See the platform, module by module
Every screenshot below is the real product, captured from the live demo — open it and click around yourself.
See the network, not a spreadsheet
Five live views, every one of them drawn from the configs and telemetry you already have.
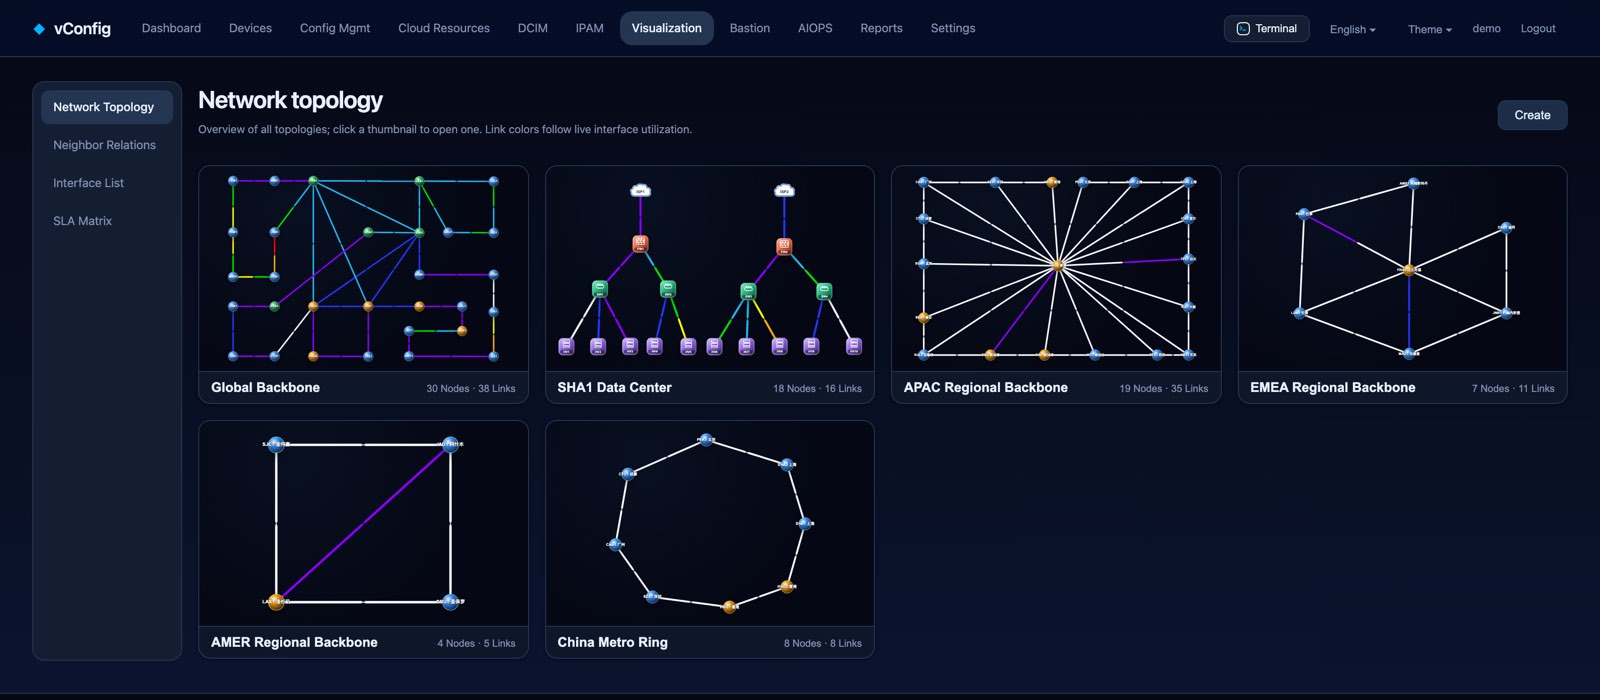
Every layer, on one wall
Backbone, region, metro, data centre. Links draw themselves from the neighbour table — the map is never the stale one on the whiteboard.
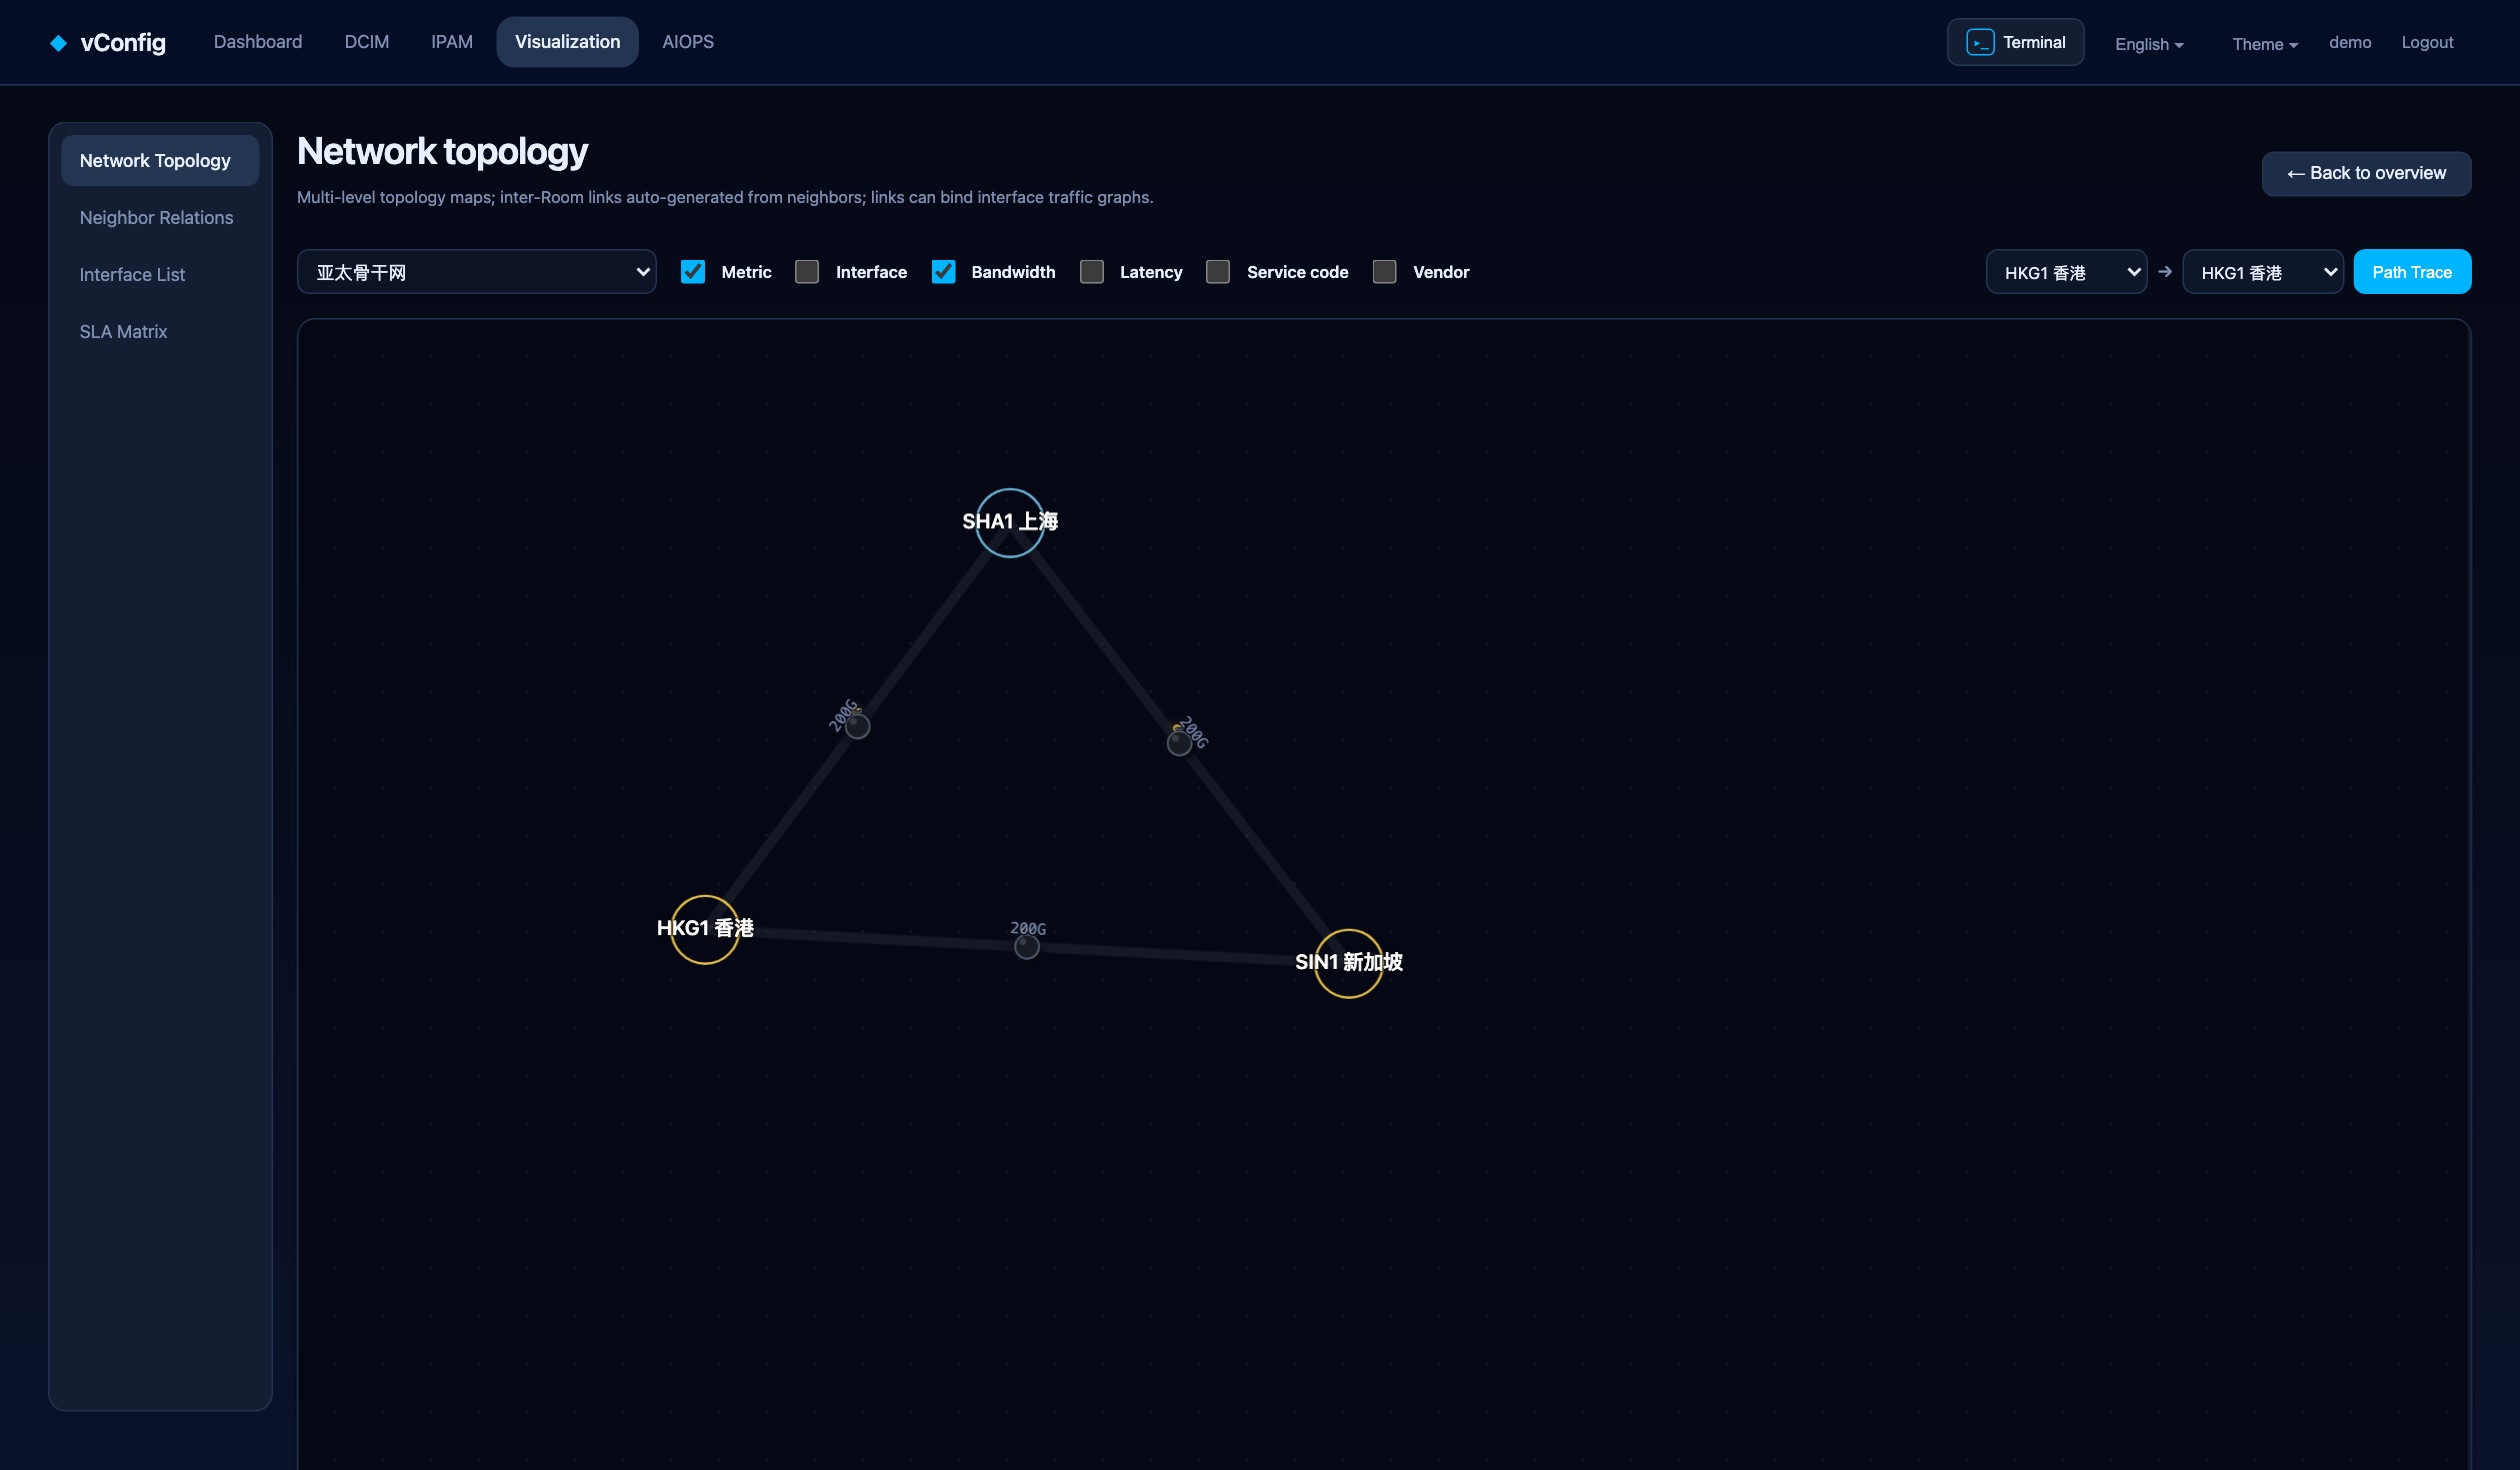
Load, drawn on the link
Colour is live utilization. Click a span for its traffic graph, or trace the path between any two sites.
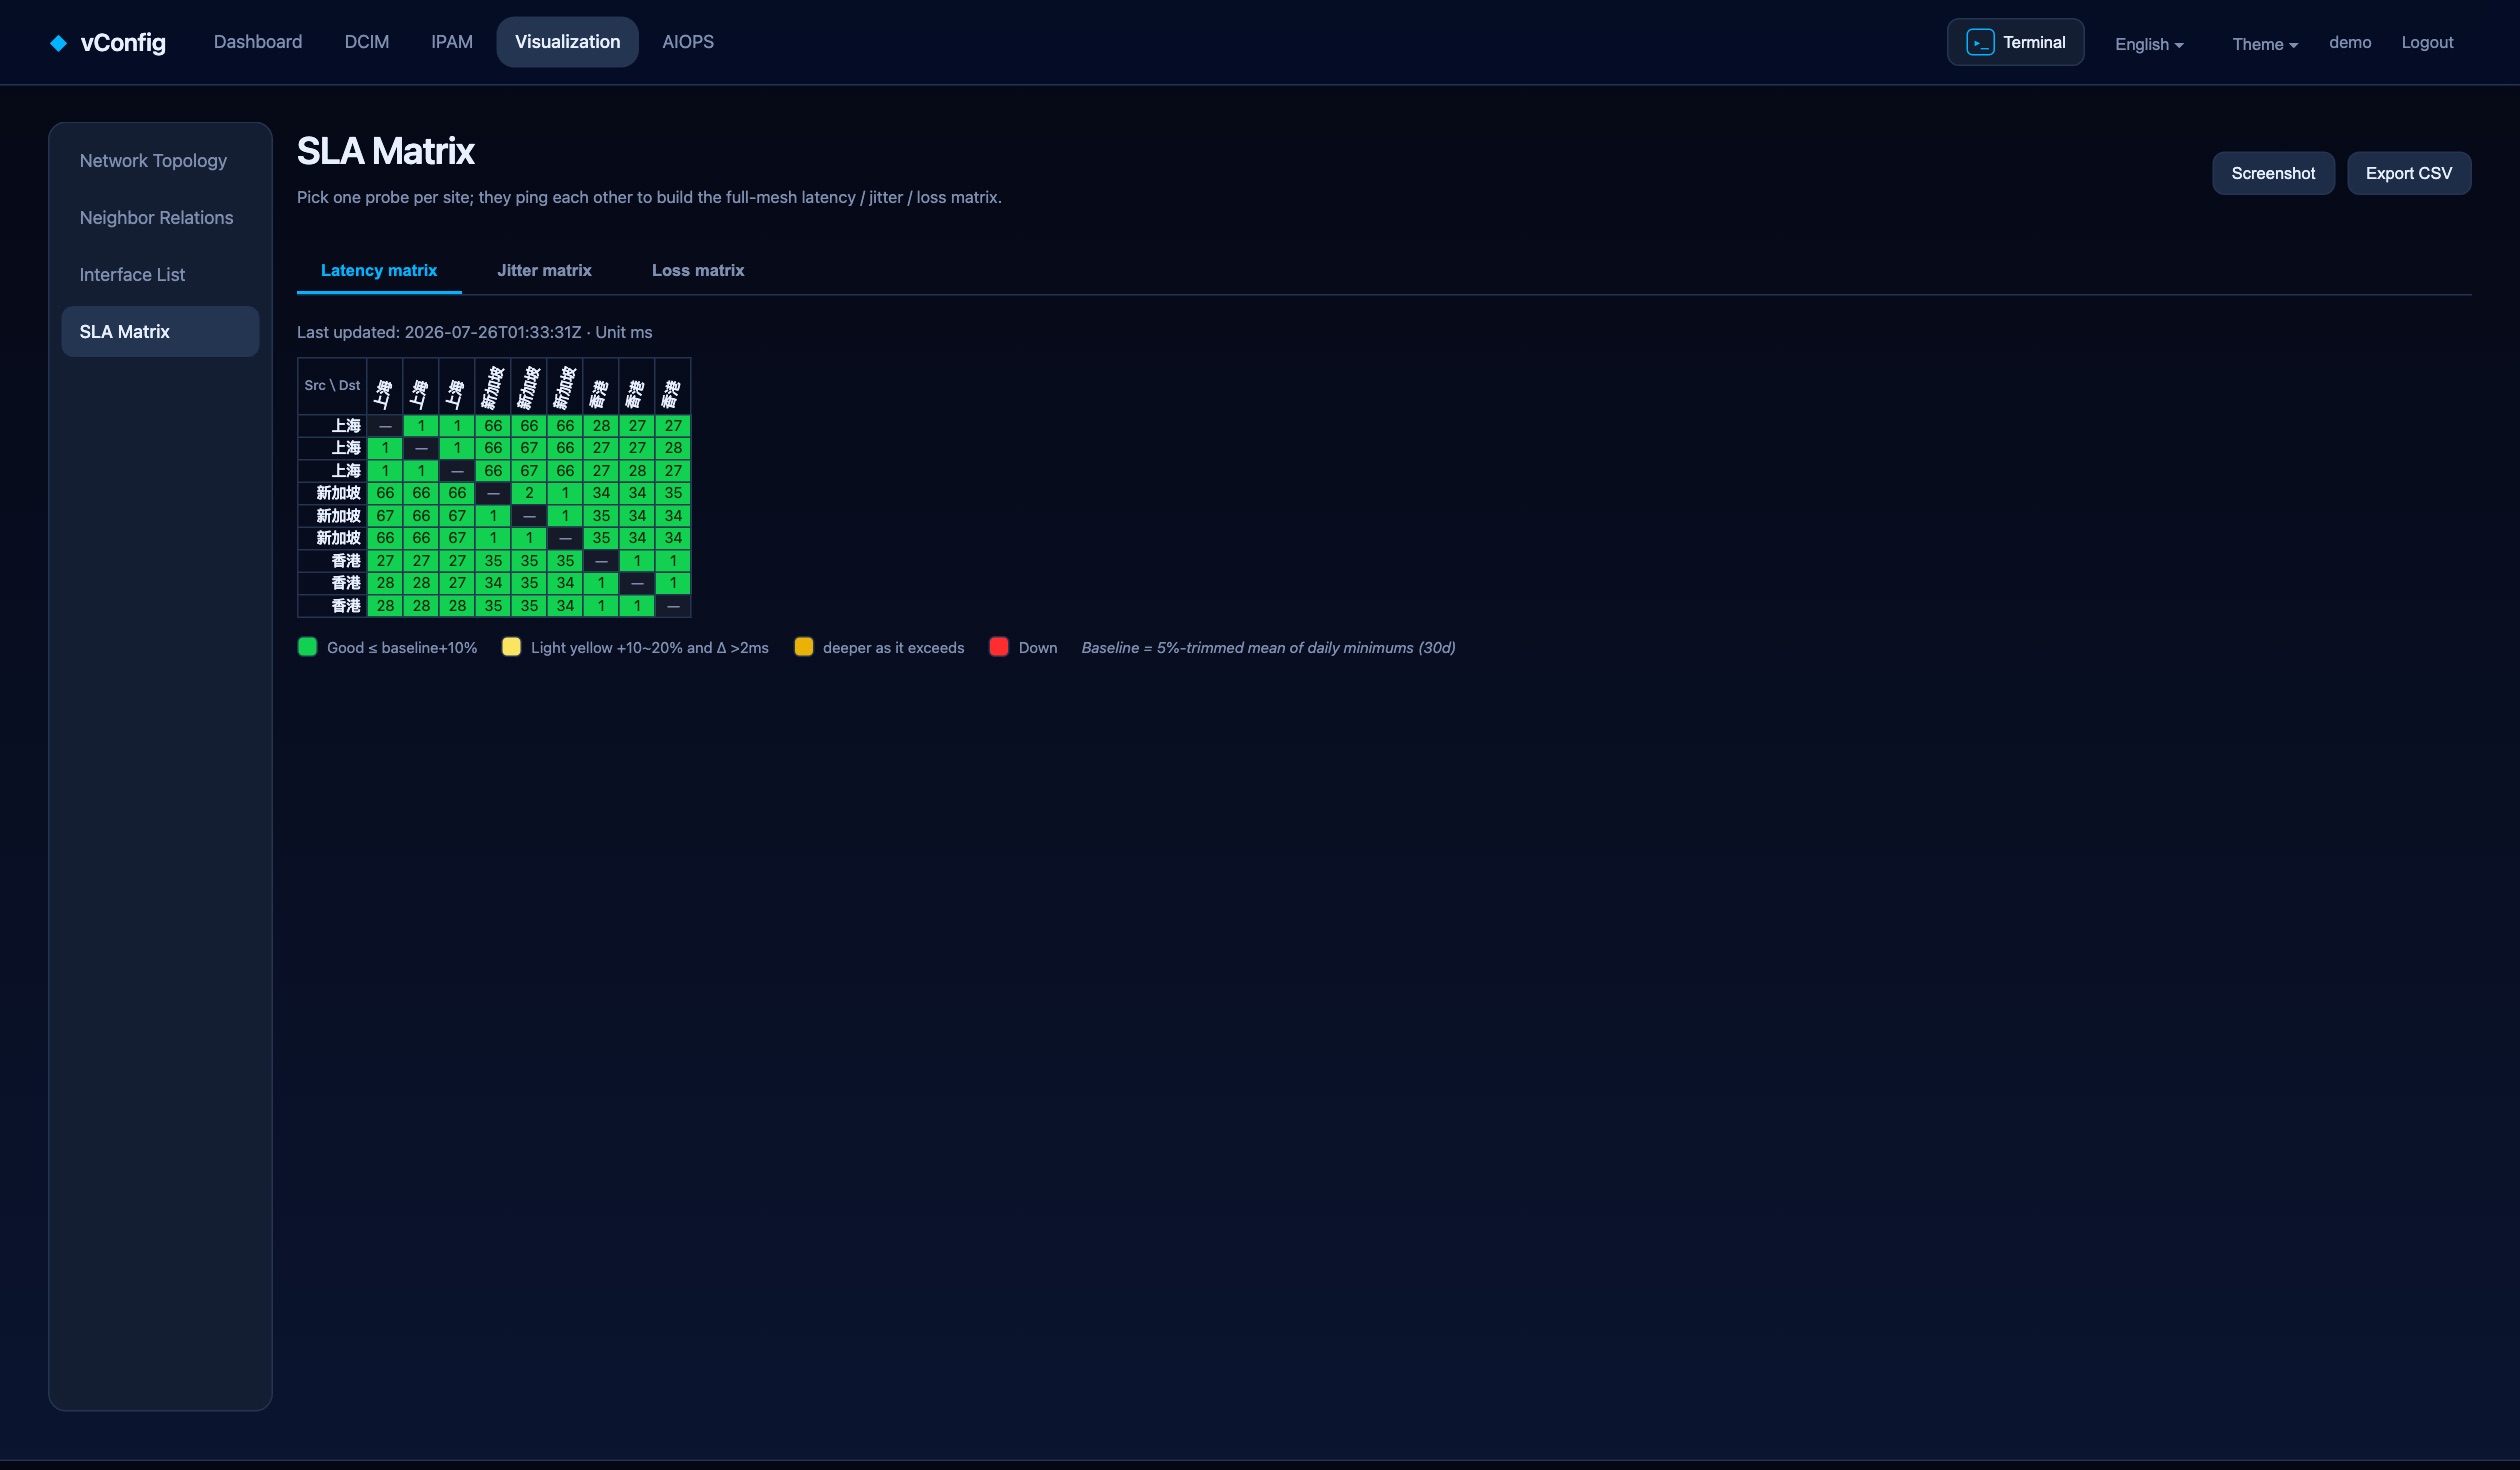
Every site to every site
Latency, jitter and loss — measured from your own routers, graded against each pair’s own baseline.
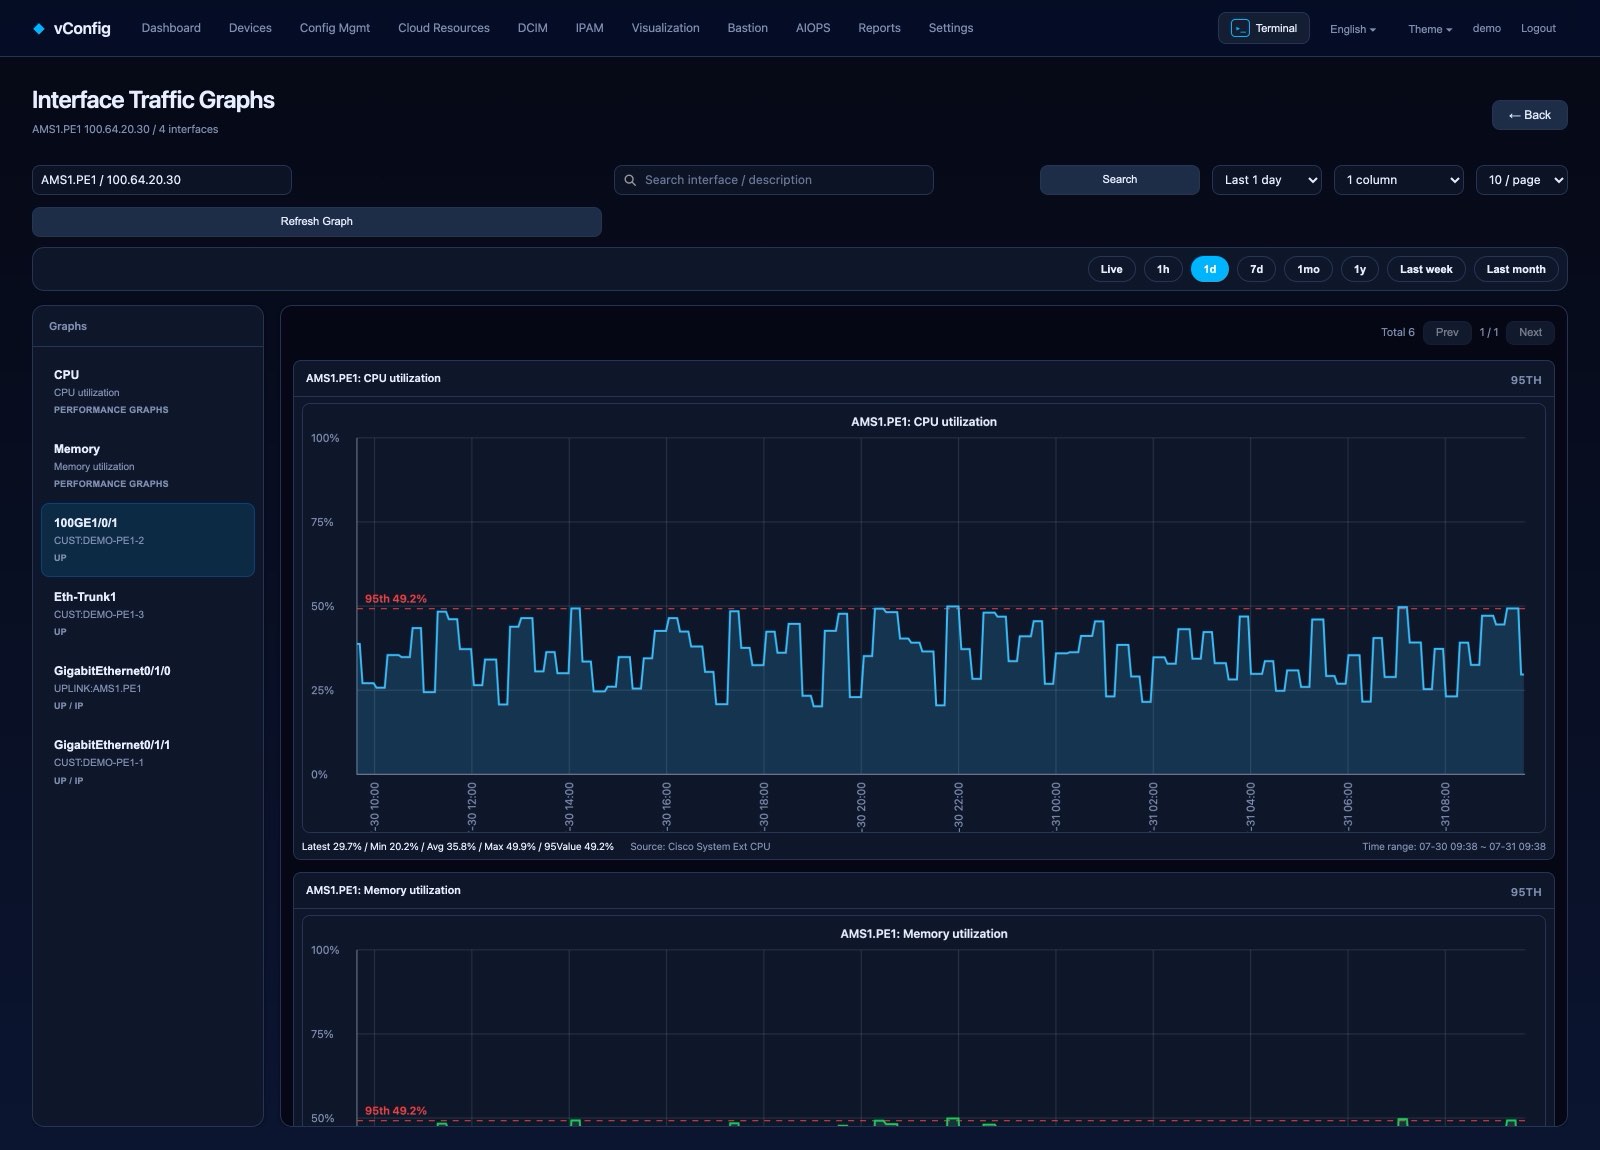
The curves you actually ask for
Per-interface throughput with 95th percentile, plus CPU and memory. Live through one year.
And who is actually using it
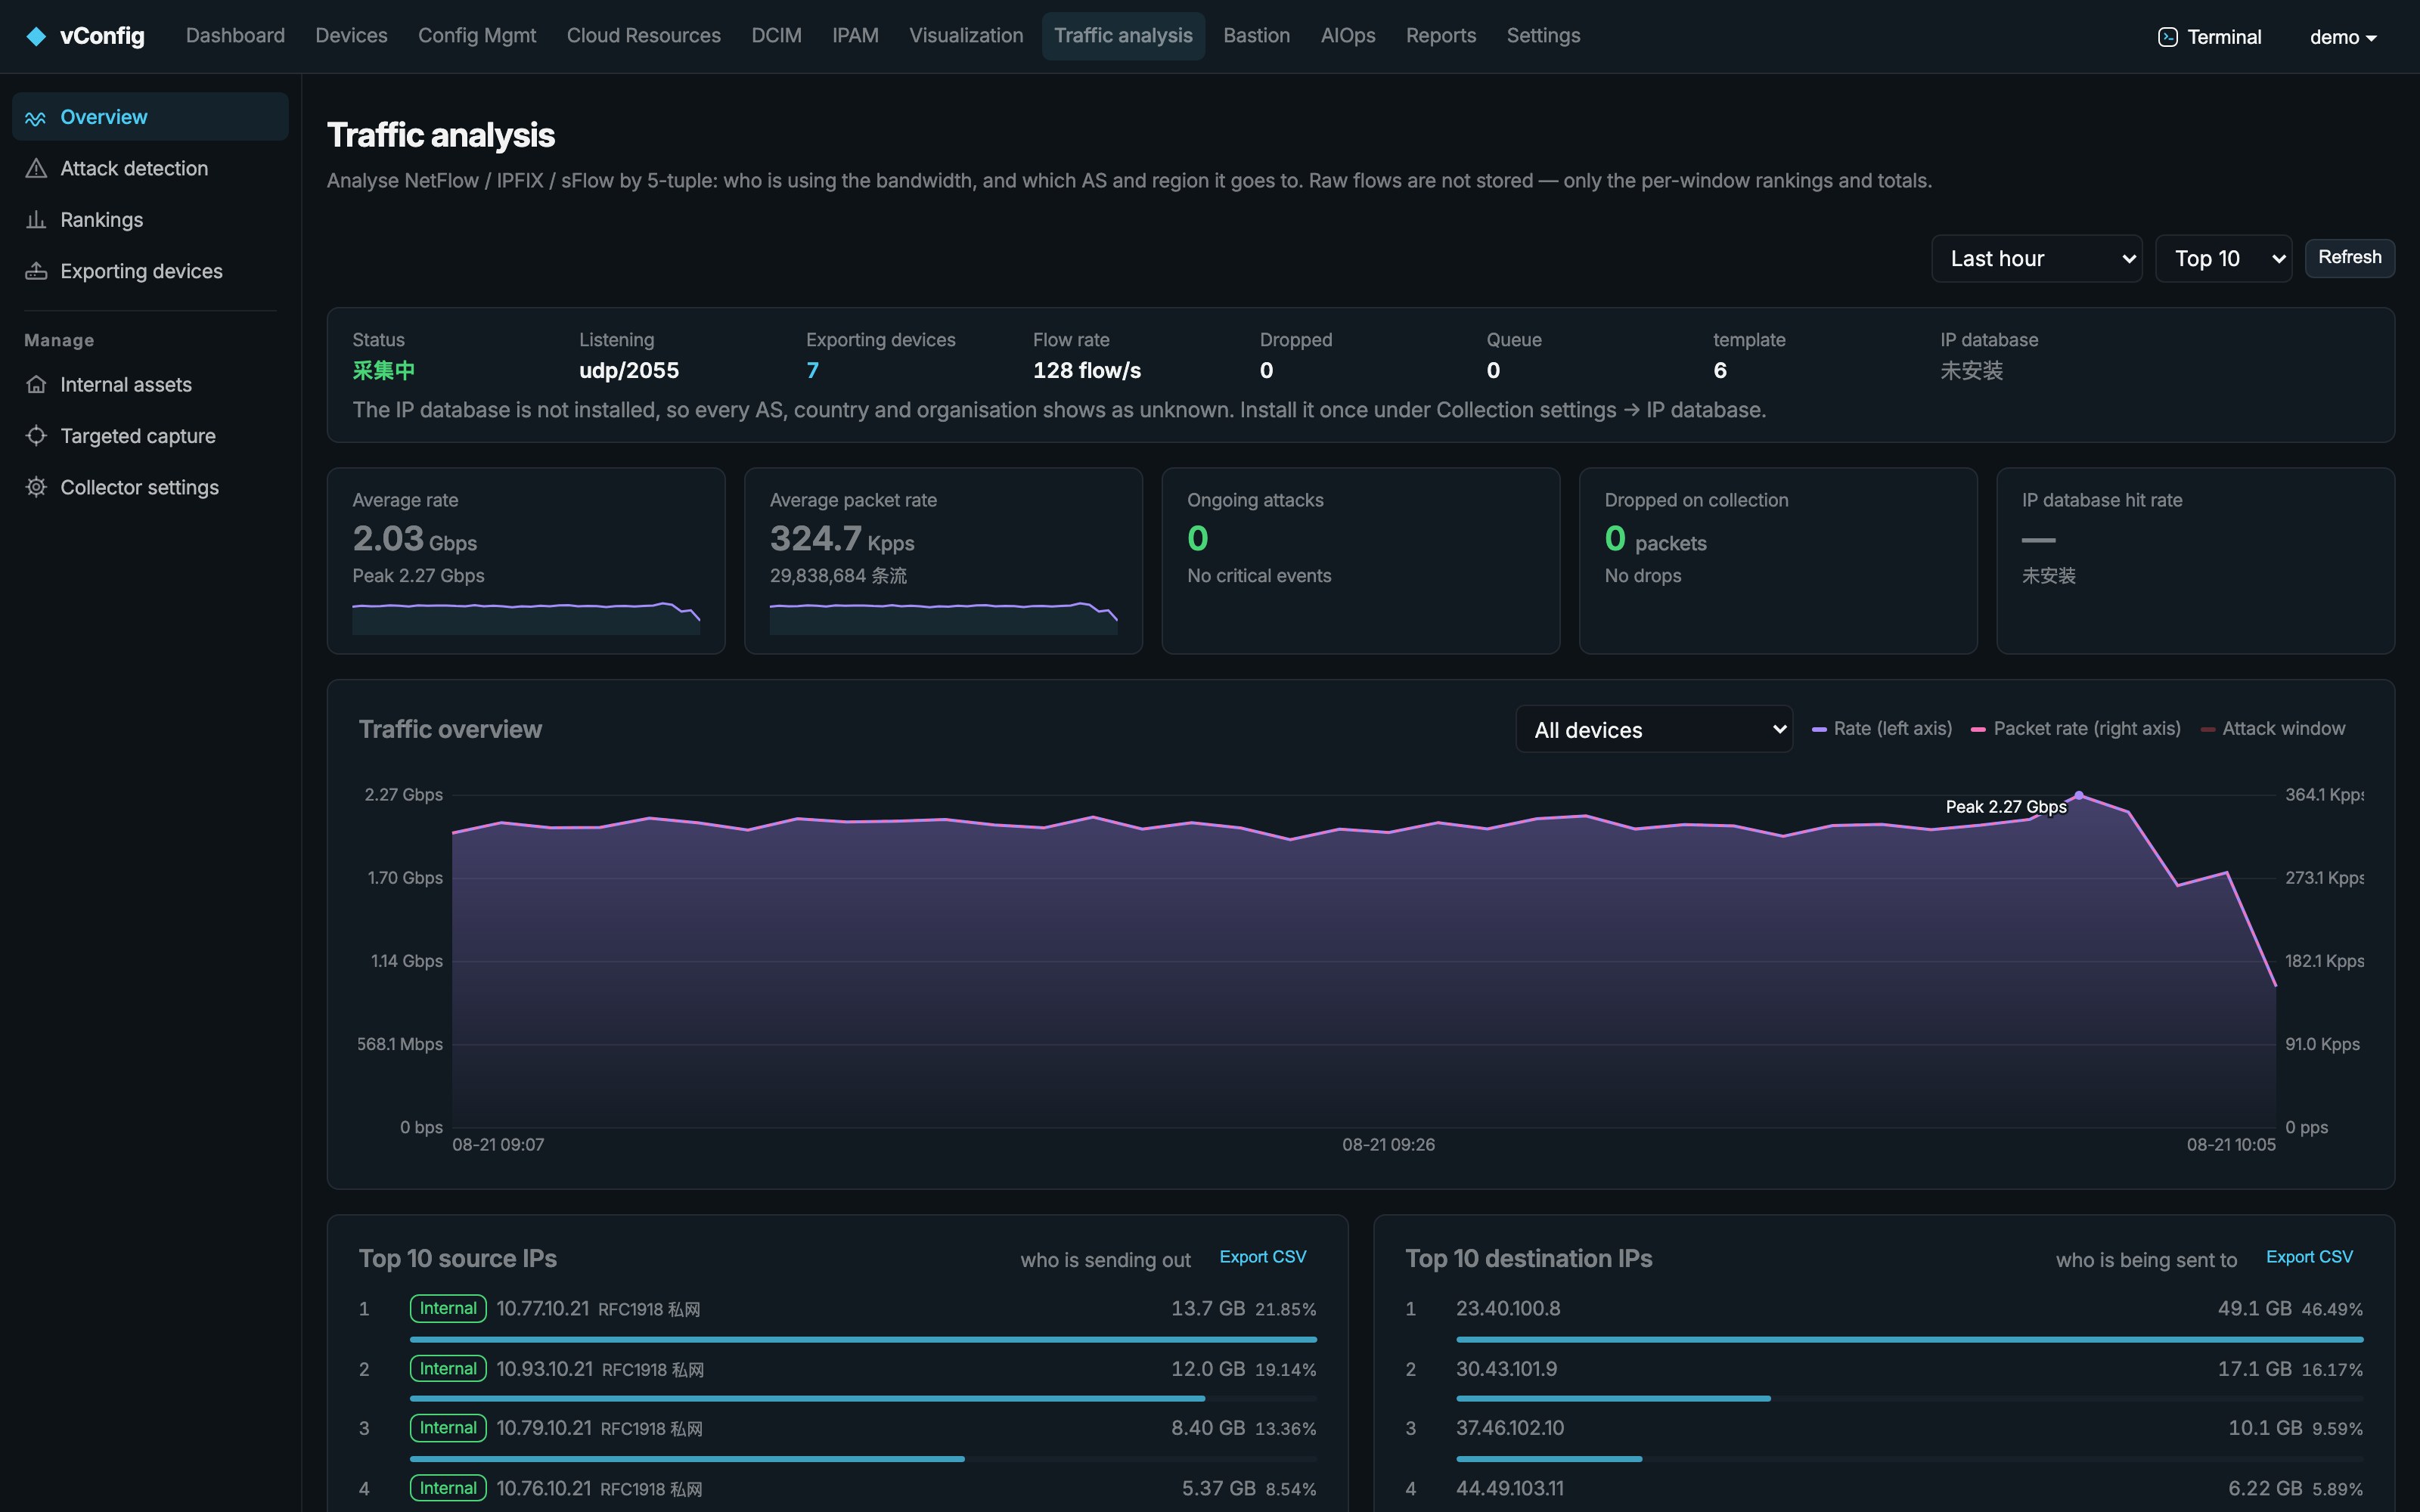
NetFlow, IPFIX and sFlow on one port. Rankings by host, conversation, port, AS and country — so a traffic spike has a name within seconds. Raw flows are never stored; targeted capture records one address on demand when you need the detail.
Configuration is the source of truth
Back it up, read what it really says, prove it still complies.
Every config, every version, every diff
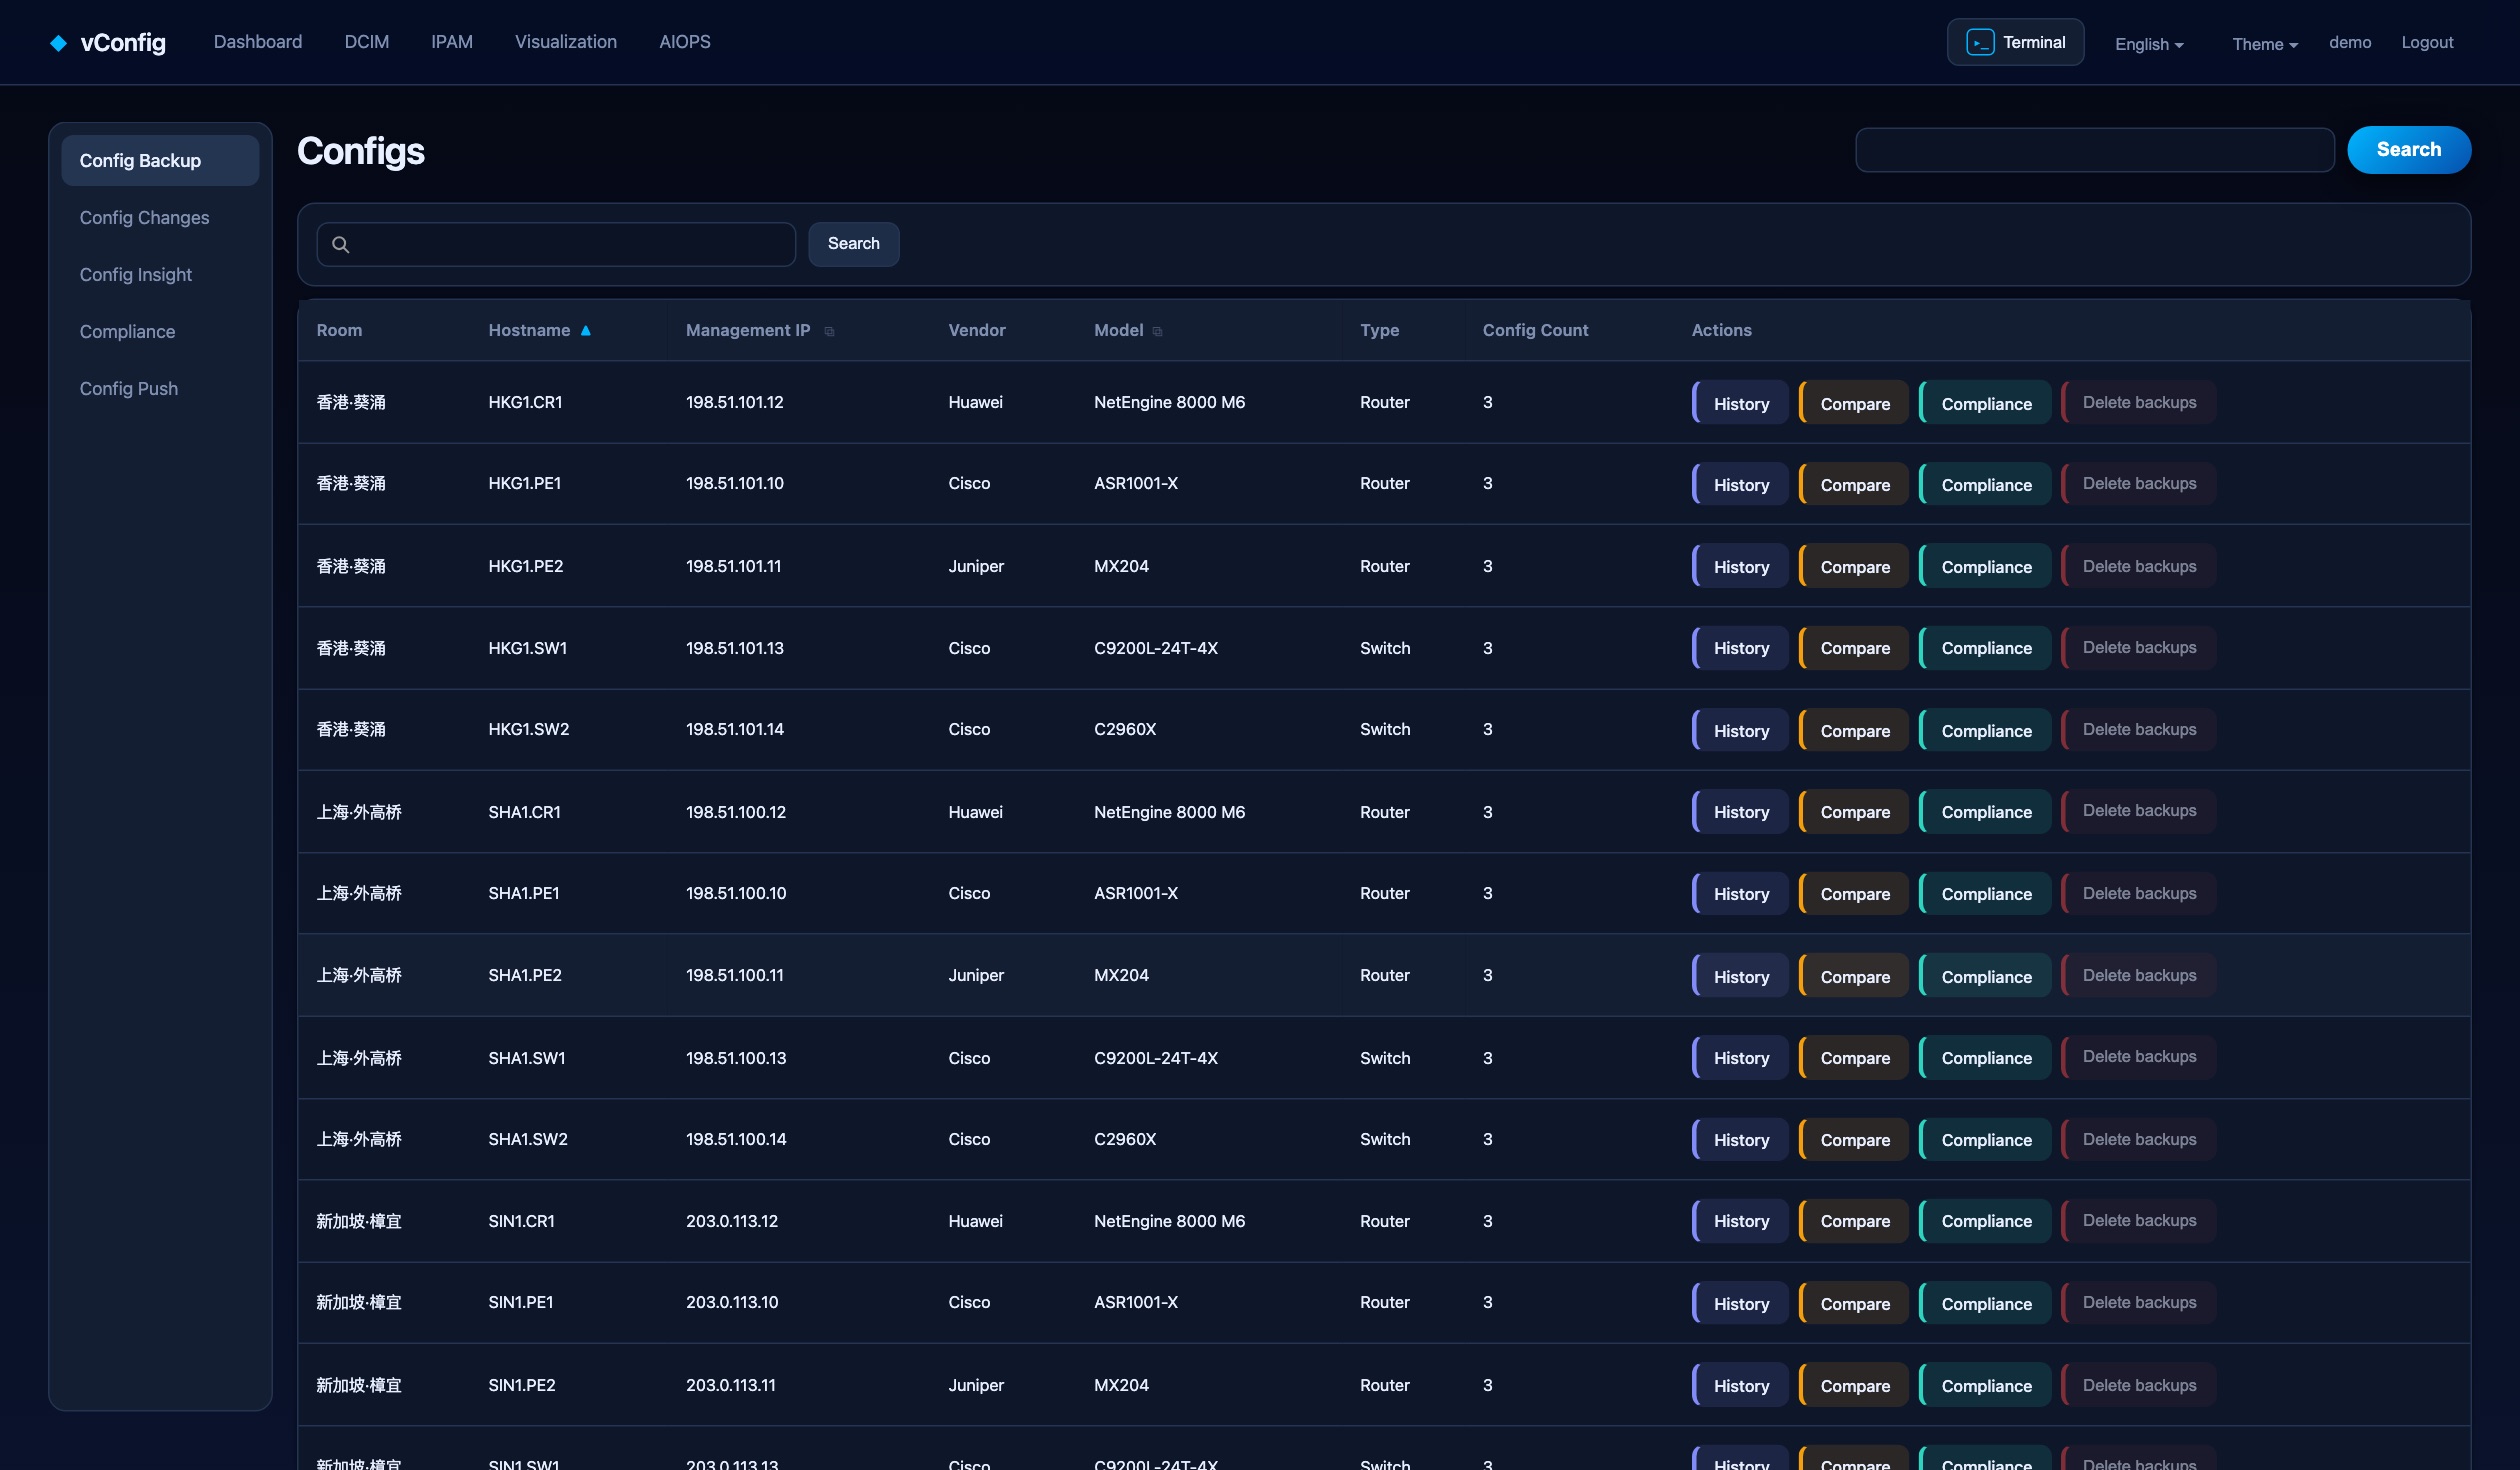
Scheduled multi-vendor backups over SSH or Telnet, full version history and side-by-side diffs — with an alert the moment someone changes a device out of band.
Config Insight
Reconstruct the business ledger hiding in the running config — who is on which interface, at what bandwidth — then reconcile it against IPAM.
Compliance
52 built-in rules across four vendors, scored per scan, with the offending lines quoted.
When something breaks
Notice it, understand it, and keep the machine out of the blast radius.
AI that never touches your devices
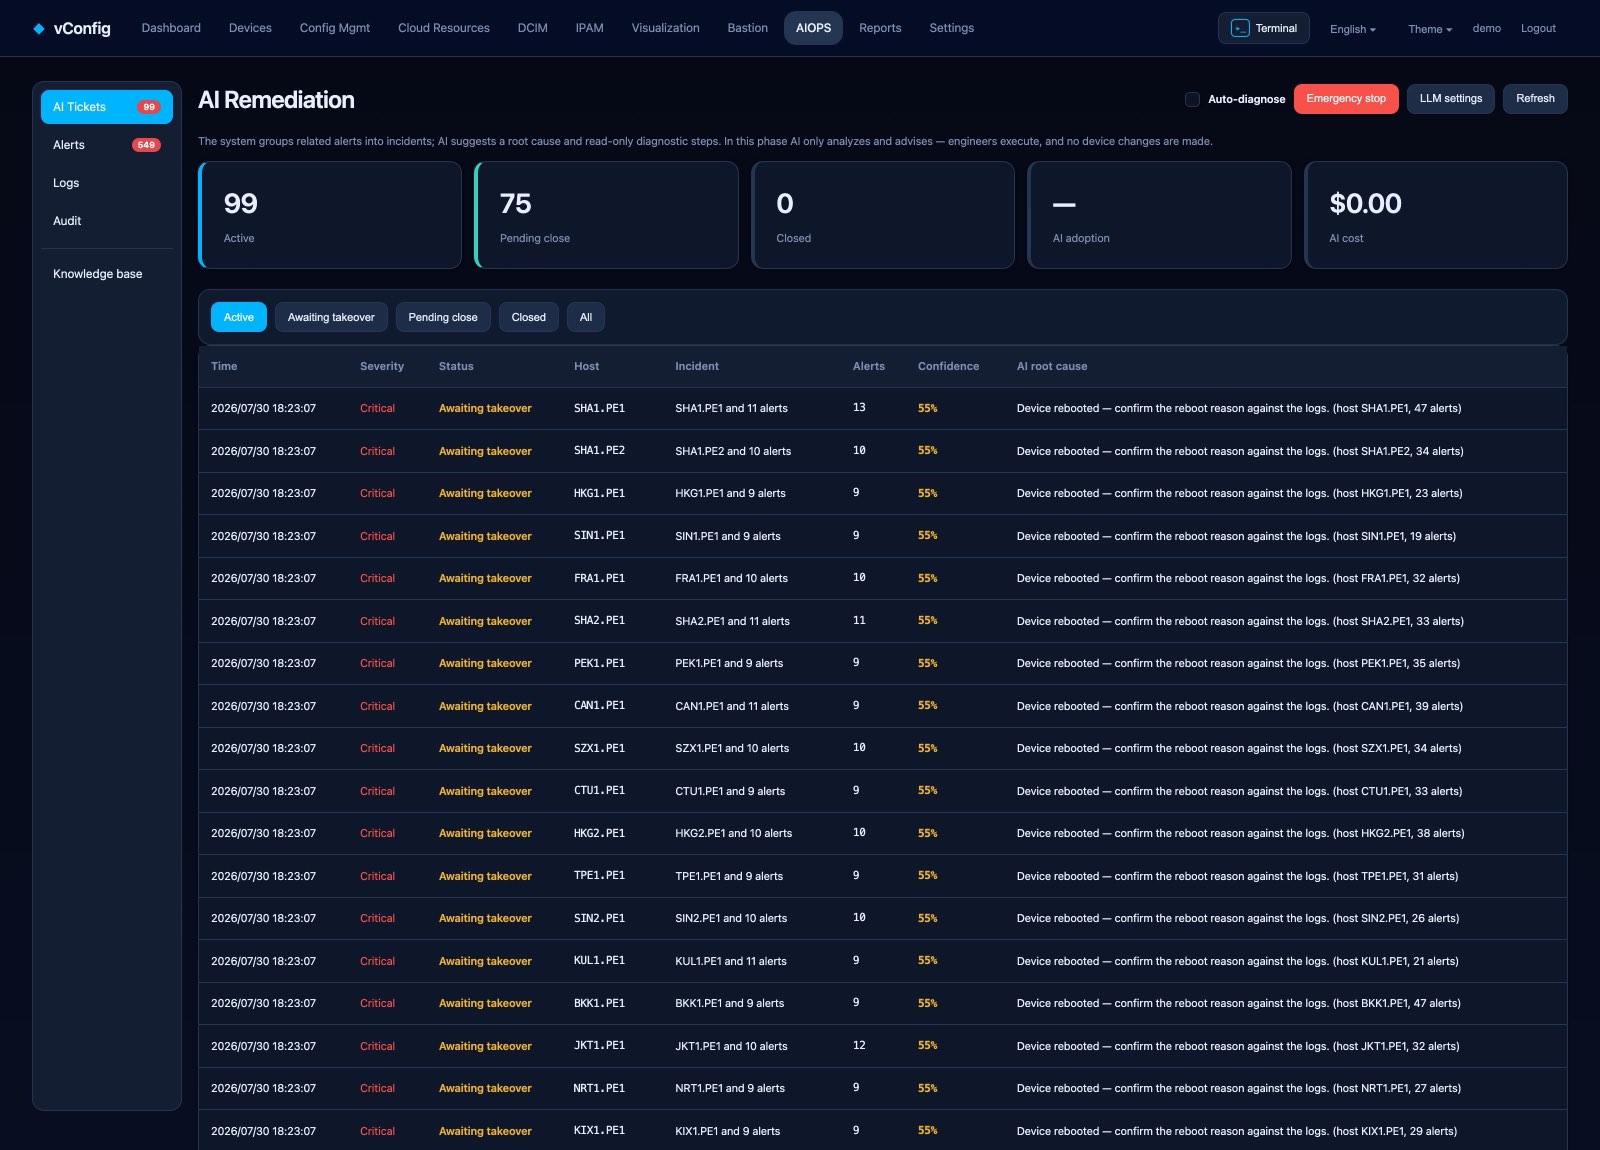
Related alerts become one incident, and the model proposes a root cause plus the read-only commands to confirm it. It analyses. A human executes.
Command centre
Backup health, device status, neighbours and inventory on one screen.
Alerts & logs
One queue for every source, with sustained-condition rules that kill flapping and pattern clustering that surfaces the unusual.
Assets and access
What is racked where, which addresses are taken, and who touched the device.
Racks drawn, not tabulated
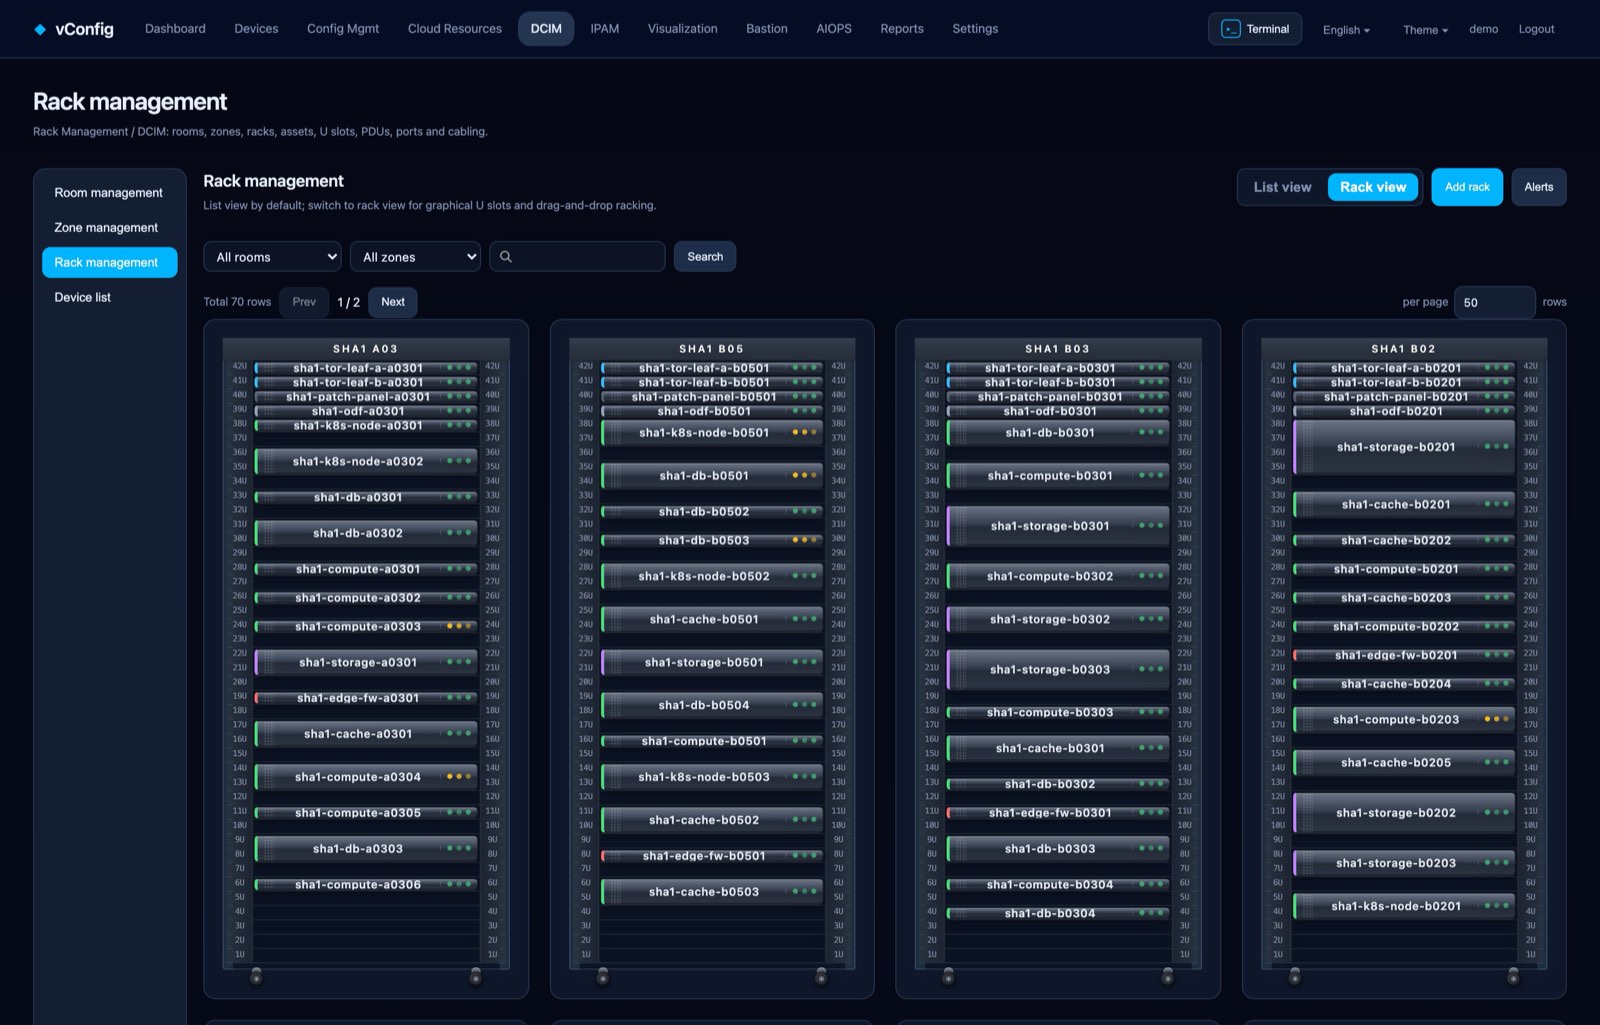
Room, zone, rack and U slot, front and rear — carrying real occupancy, power and weight. Drag a device in to mount it.
IPAM
An address ledger continuously reconciled against what the devices are actually configured to do.
Bastion
Browser shell to any device. Every session recorded and replayable, every command indexed.
And the rest of the platform
Every capability ships in every plan — pricing scales only with device count.
Automation & Change
Jinja2 config templates, bulk change execution with pre-flight validation, Git-backed version repository and configuration drift detection.
Discovery
SNMP subnet scanning with auto-enrollment and type matching, so a device installed last night is in the inventory this morning — not whenever somebody remembers to add it.
Security & Access Control
Role-based access with per-group device scoping, local accounts or LDAP, API tokens, encrypted credential storage (Fernet), CSRF protection, hardened sessions, optional strict SSH host-key verification and full audit logging.
Multi-cloud
Cloud accounts with encrypted credentials and read-only resource collection — compute, networks, EIPs and bills — via an extensible connector SPI.
Platform
8-language interface, dark/light themes, webhook notifications (Slack, Teams, WeCom, DingTalk, Feishu), REST API with tokens, Docker deployment, scheduled jobs and built-in server health monitoring.
See it on your own network
Free for 10 devices — every feature included. Install in minutes.
Get Started — Free