Dashboard
The dashboard is the first screen after login and the one page a NOC can leave on a wall display. Everything on it is a link — each card drills into the module behind it.
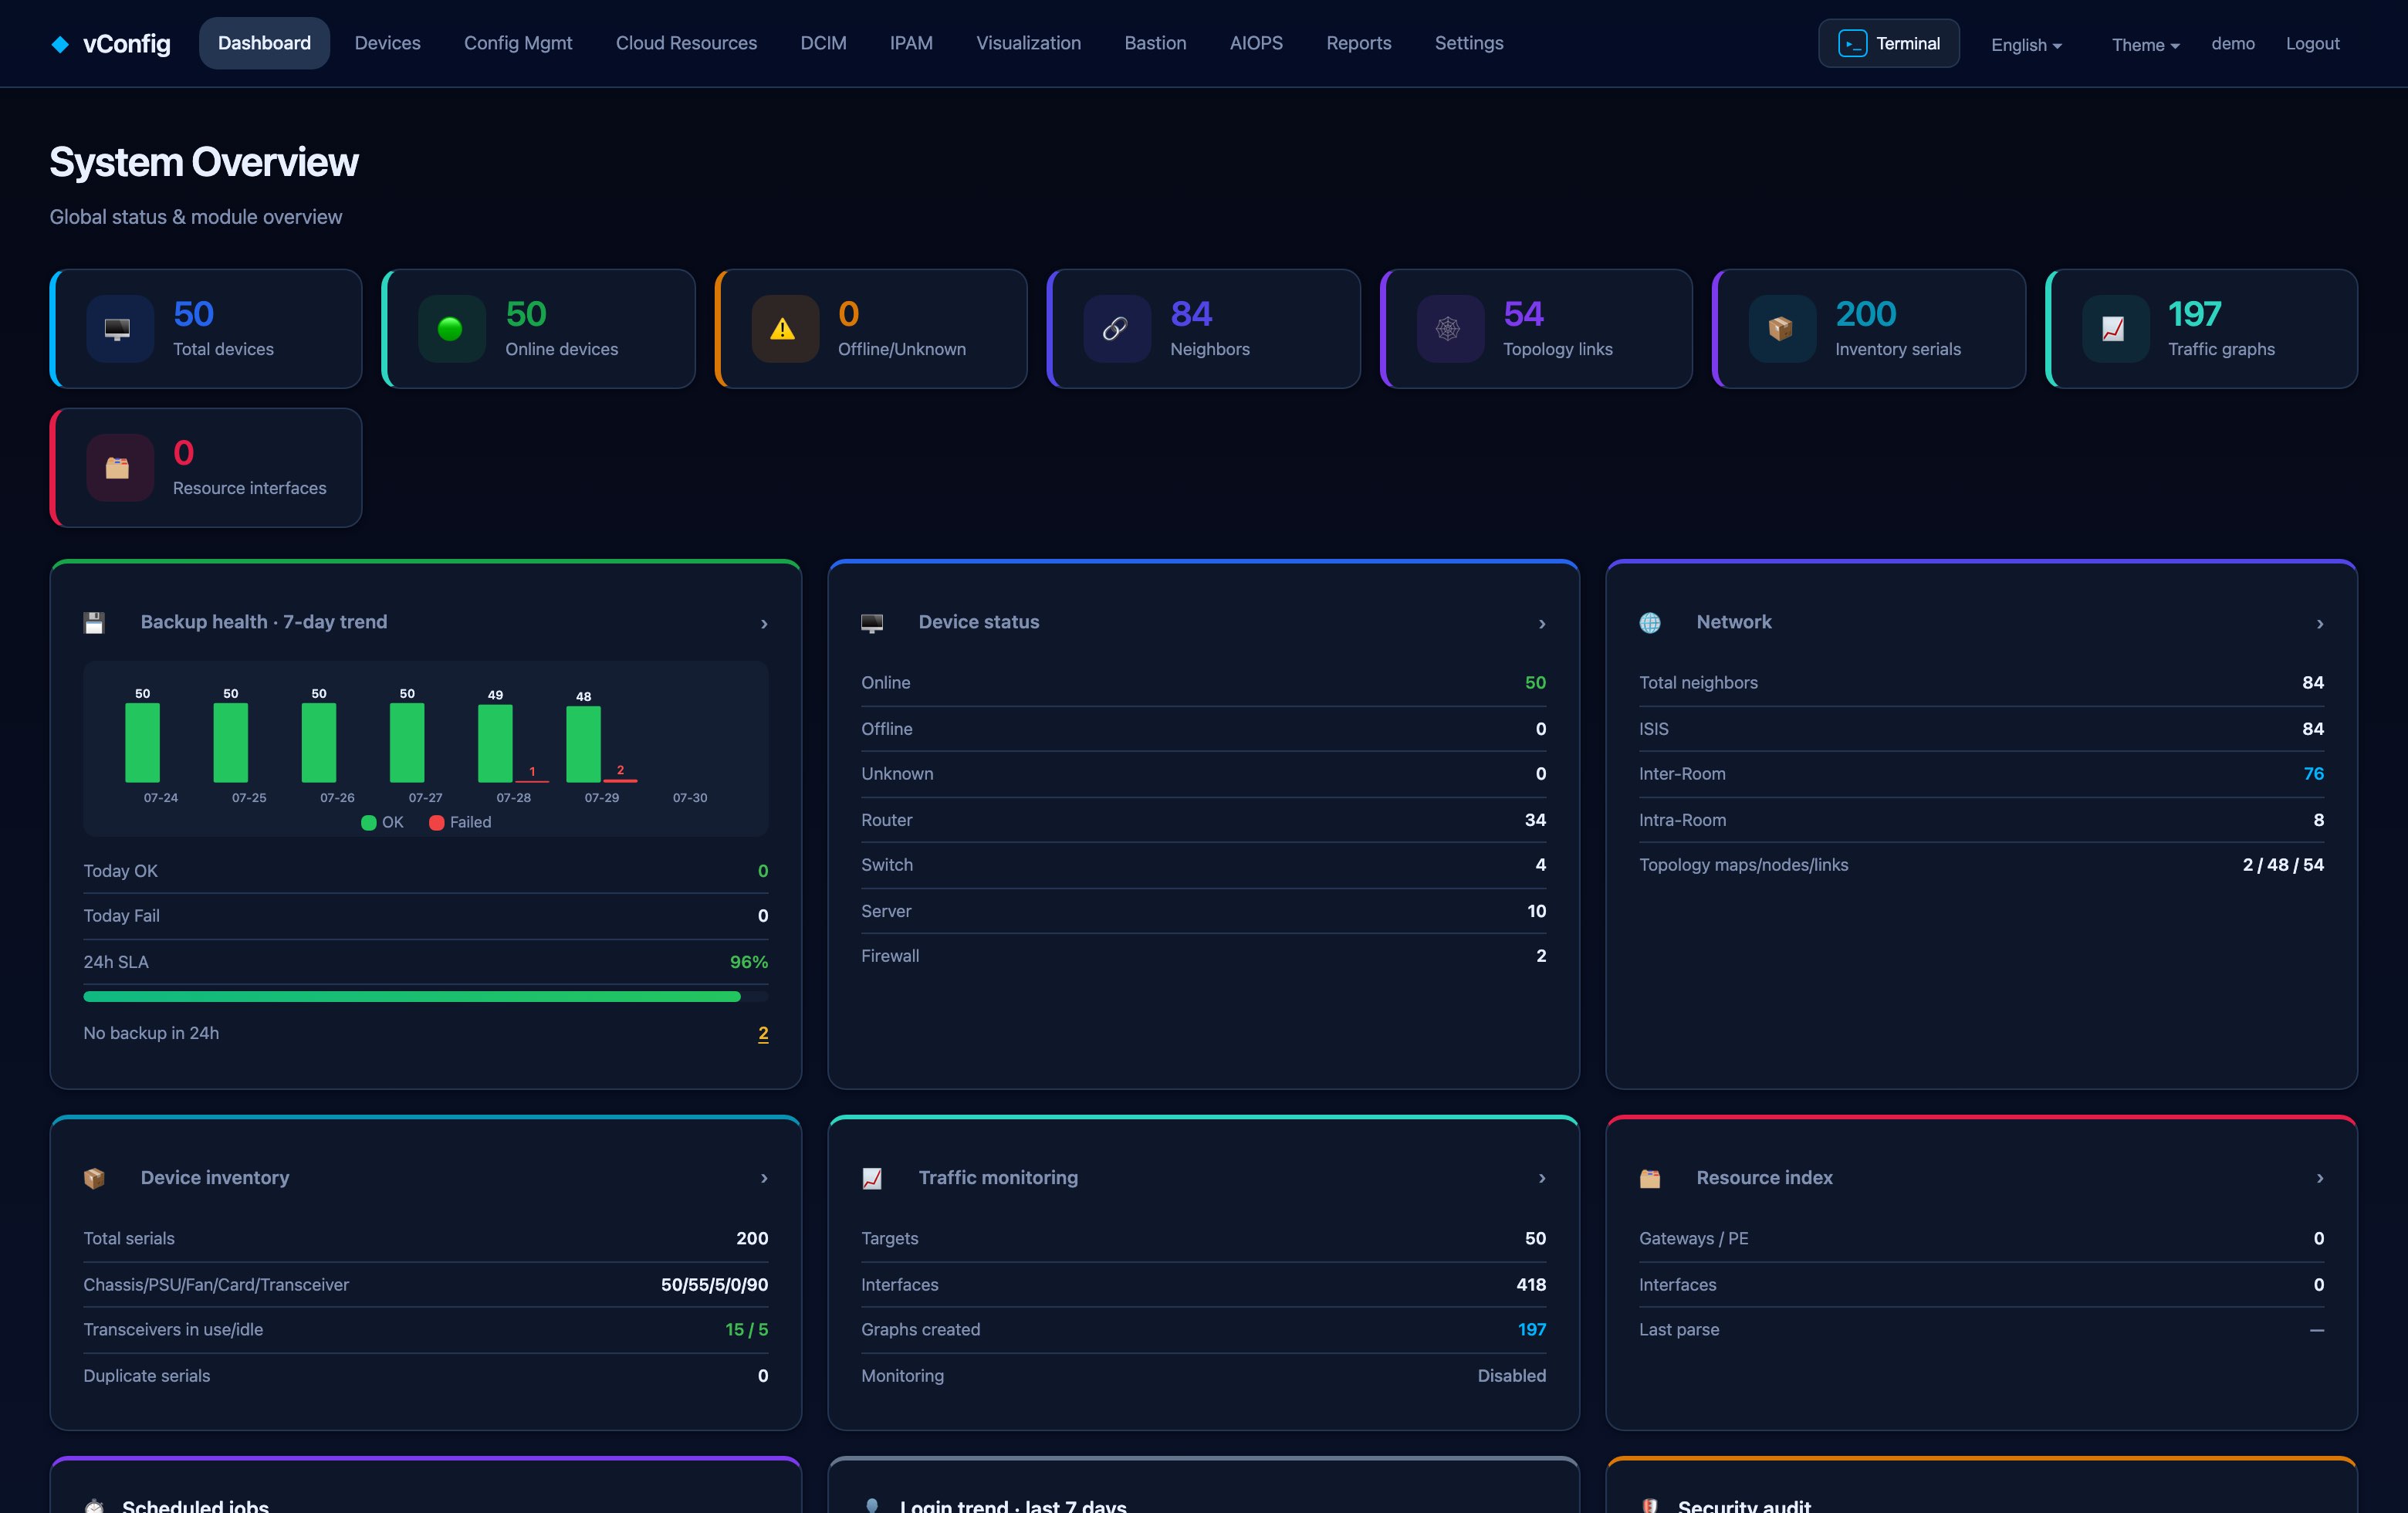
What it shows
| Card | Answers |
|---|---|
| Backup health, 7-day trend | Did last night's backup run, and is it getting worse? Each bar is one day; the number on top of the bar is how many devices were in scope that day. |
| 24h success rate by type / by group | Is the failure concentrated in one vendor or one site, or is it spread evenly? A vendor-shaped failure is usually a credential or command problem; a site-shaped one is usually reachability. |
| Backup failures | The actual failing devices, with the error the device returned — not just a count. |
| Device status | Reachable / unreachable / unknown, from the status probe. |
| Neighbors & topology counts | How much of the network the platform can see. |
| Hardware inventory | Modules, optics and serials collected by online inventory. |
| Resource index | Prefixes, VLANs, VRFs and circuits known to IPAM. |
| Security audit | Recent logins, permission denials and configuration changes. |
Reading it in the morning
The intended sequence takes about thirty seconds:
- Look at the 7-day trend. A flat line at 100% means nothing needs your attention.
- If yesterday dipped, check by type / by group to see the shape of the failure.
- Open Backup failures and read the device's own error message.
- Fix the cause, then hit Back up now on just those devices from Configuration Backup — no need to wait for tonight.
Wall display
The dashboard refreshes on its own. Sign in with a read-only account (see Users & Access Control) on the machine driving the display so a passer-by cannot change anything.