SLA Matrix
The SLA matrix measures your backbone the way your customers experience it: from your own routers, not from a probe box in one data center.
How it works
vConfig logs into each source device and pings the far end, recording latency, jitter and packet loss into a full-mesh matrix. Three tabs — latency, jitter, loss — are three lenses on the same measurement run.
- Ping dialects are chosen per vendor automatically: Cisco style (also Arista and Centec), Huawei style (also H3C), Junos, RouterOS and Linux. An unrecognised vendor falls back to Cisco syntax.
- One login per source device per cycle. All destinations for a source are measured in that single session, which keeps the load off control planes that do not enjoy being logged into every minute.
- Self-healing. An offline source is detected and retried without blocking the rest of the cycle, so one dead router does not cost you the whole matrix.
Setting up
- Visualization → SLA matrix → node management — define the nodes that form the mesh. A node is a source device plus the address others should ping it on.
- Settings → Monitoring settings → SLA matrix probe settings — frequency, packet count, timeout, history retention and concurrency.
- Let one cycle run; the matrix fills in.
Node management is a separate permission from viewing the matrix, so a NOC can read the board without being able to change what is measured.
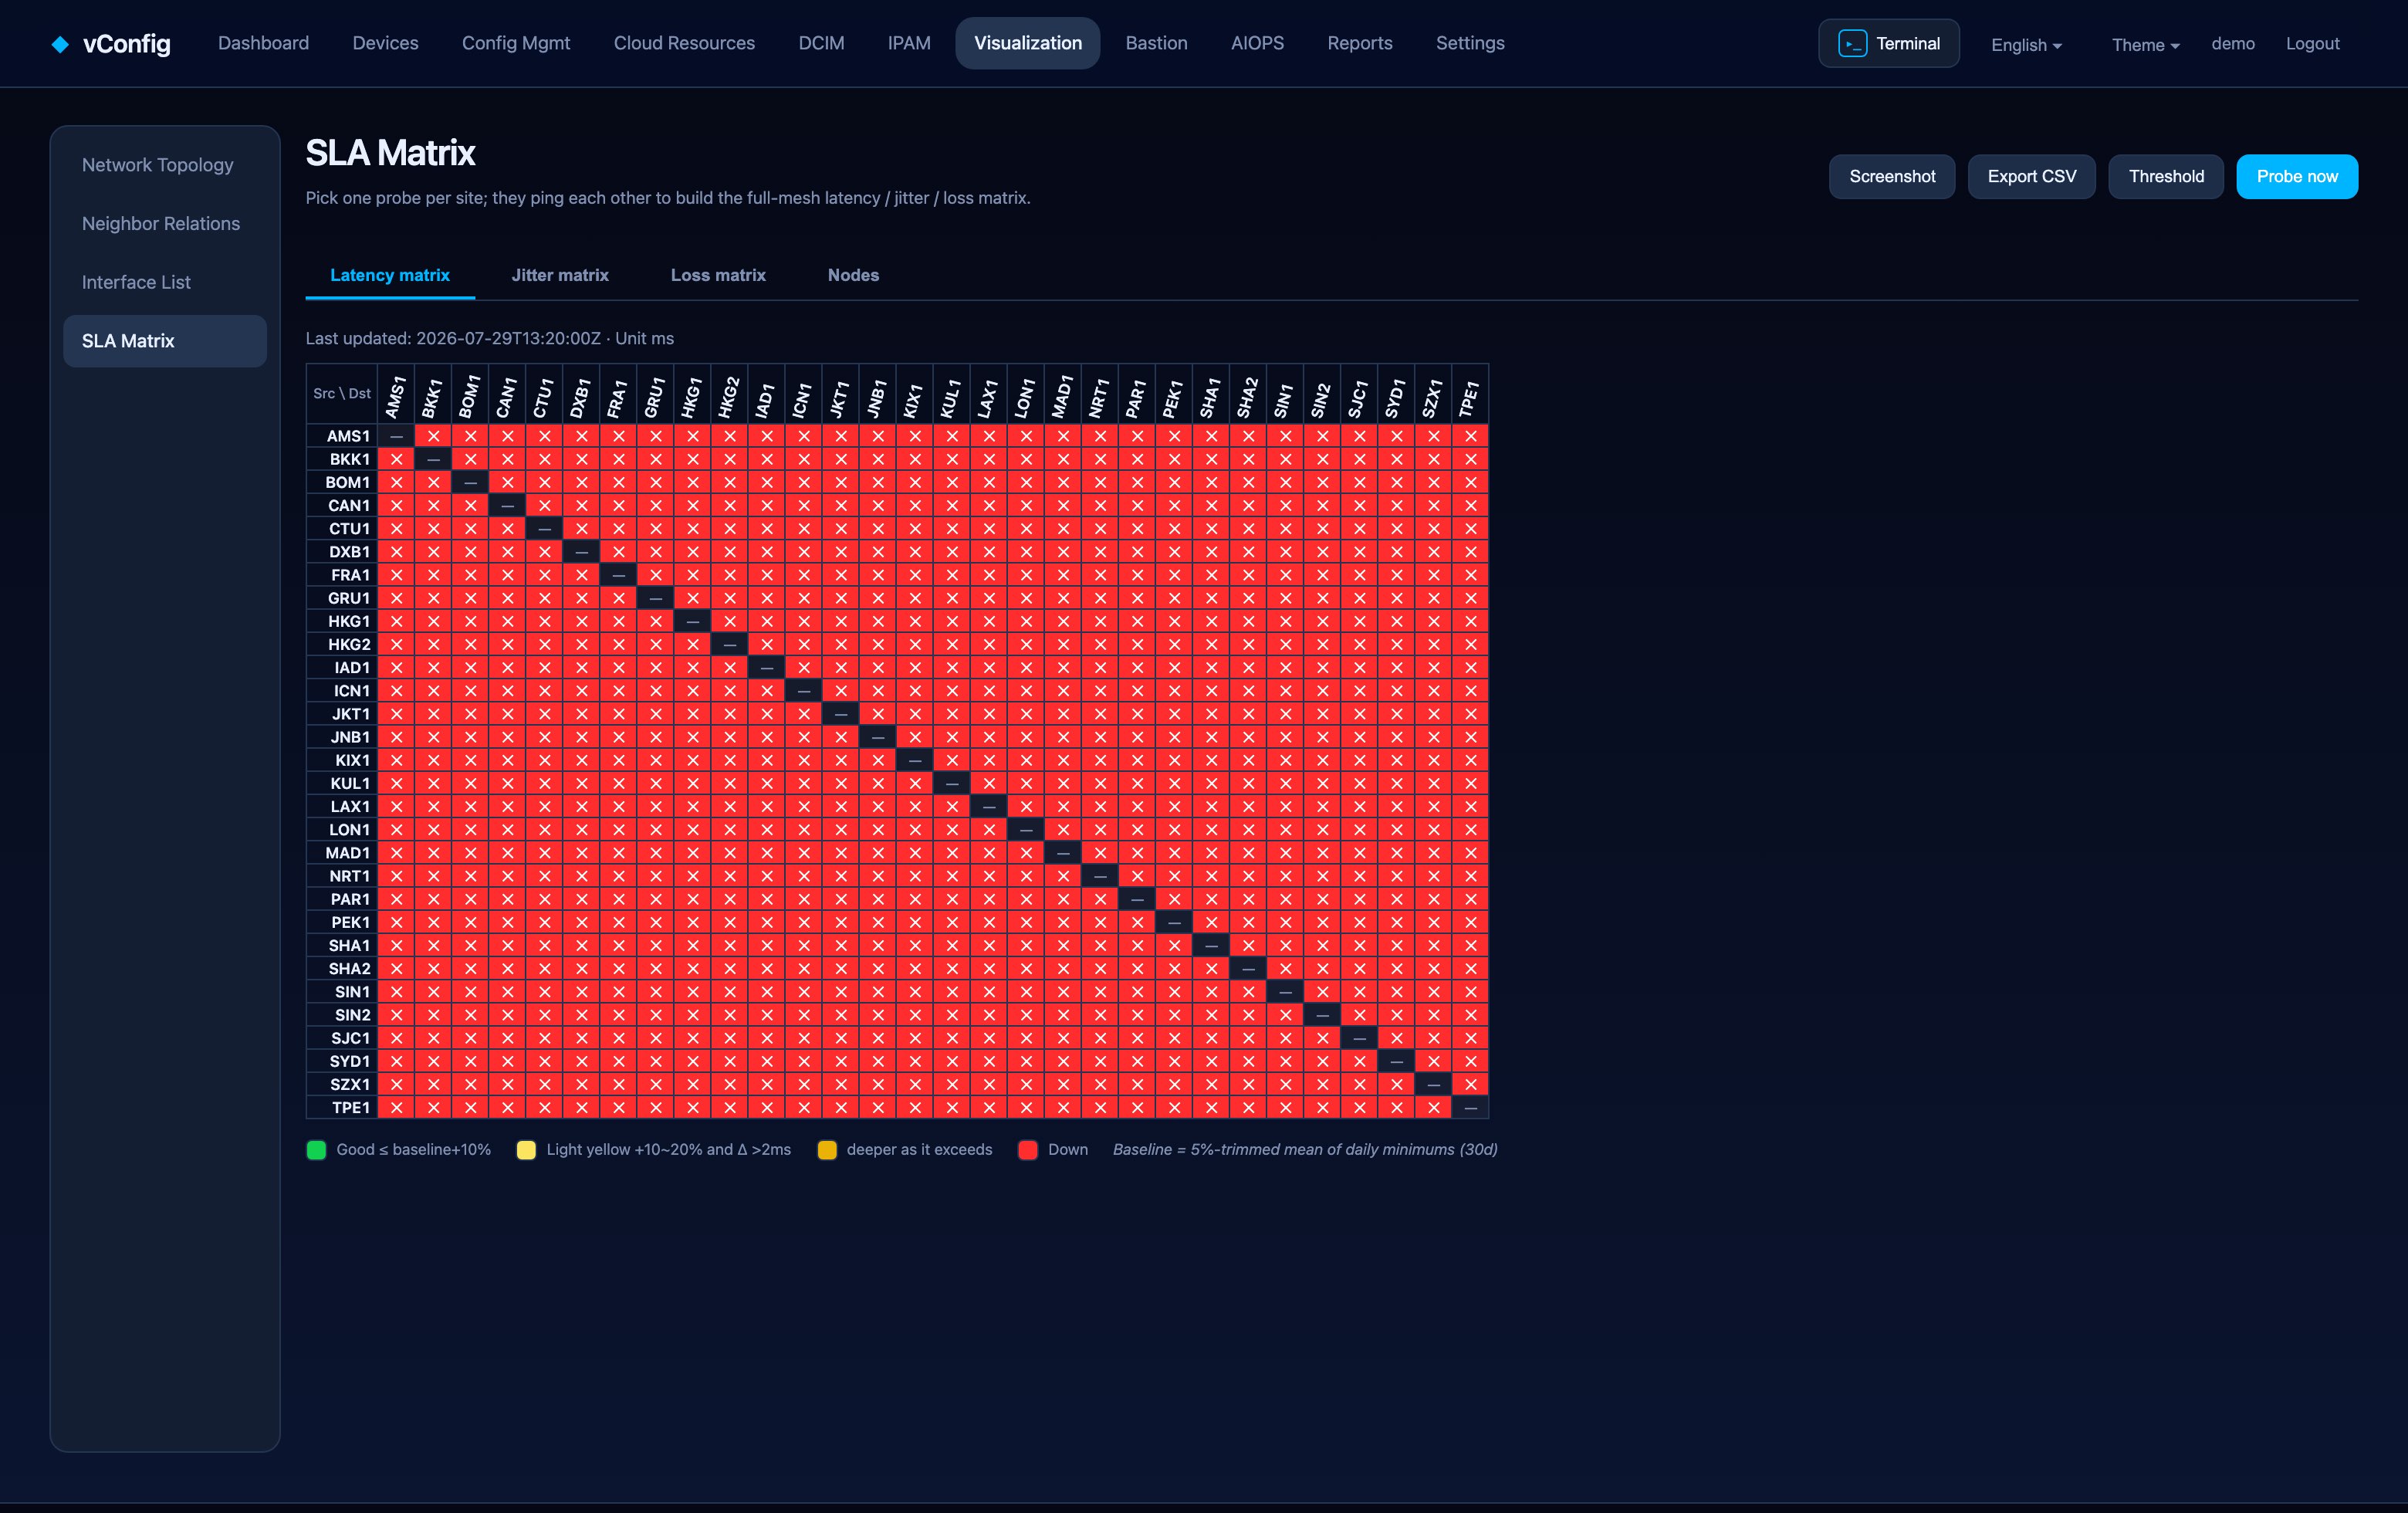
Reading the matrix
Rows are sources, columns are destinations, each cell is the current value with its history behind it. What you are looking for is asymmetry: A→B fine and B→A degraded points at one direction of one circuit, and that is a much smaller haystack than "the network is slow".