Interface Traffic
Interface traffic is collected over SNMP and rendered as history you can actually look back through — not just a live gauge.
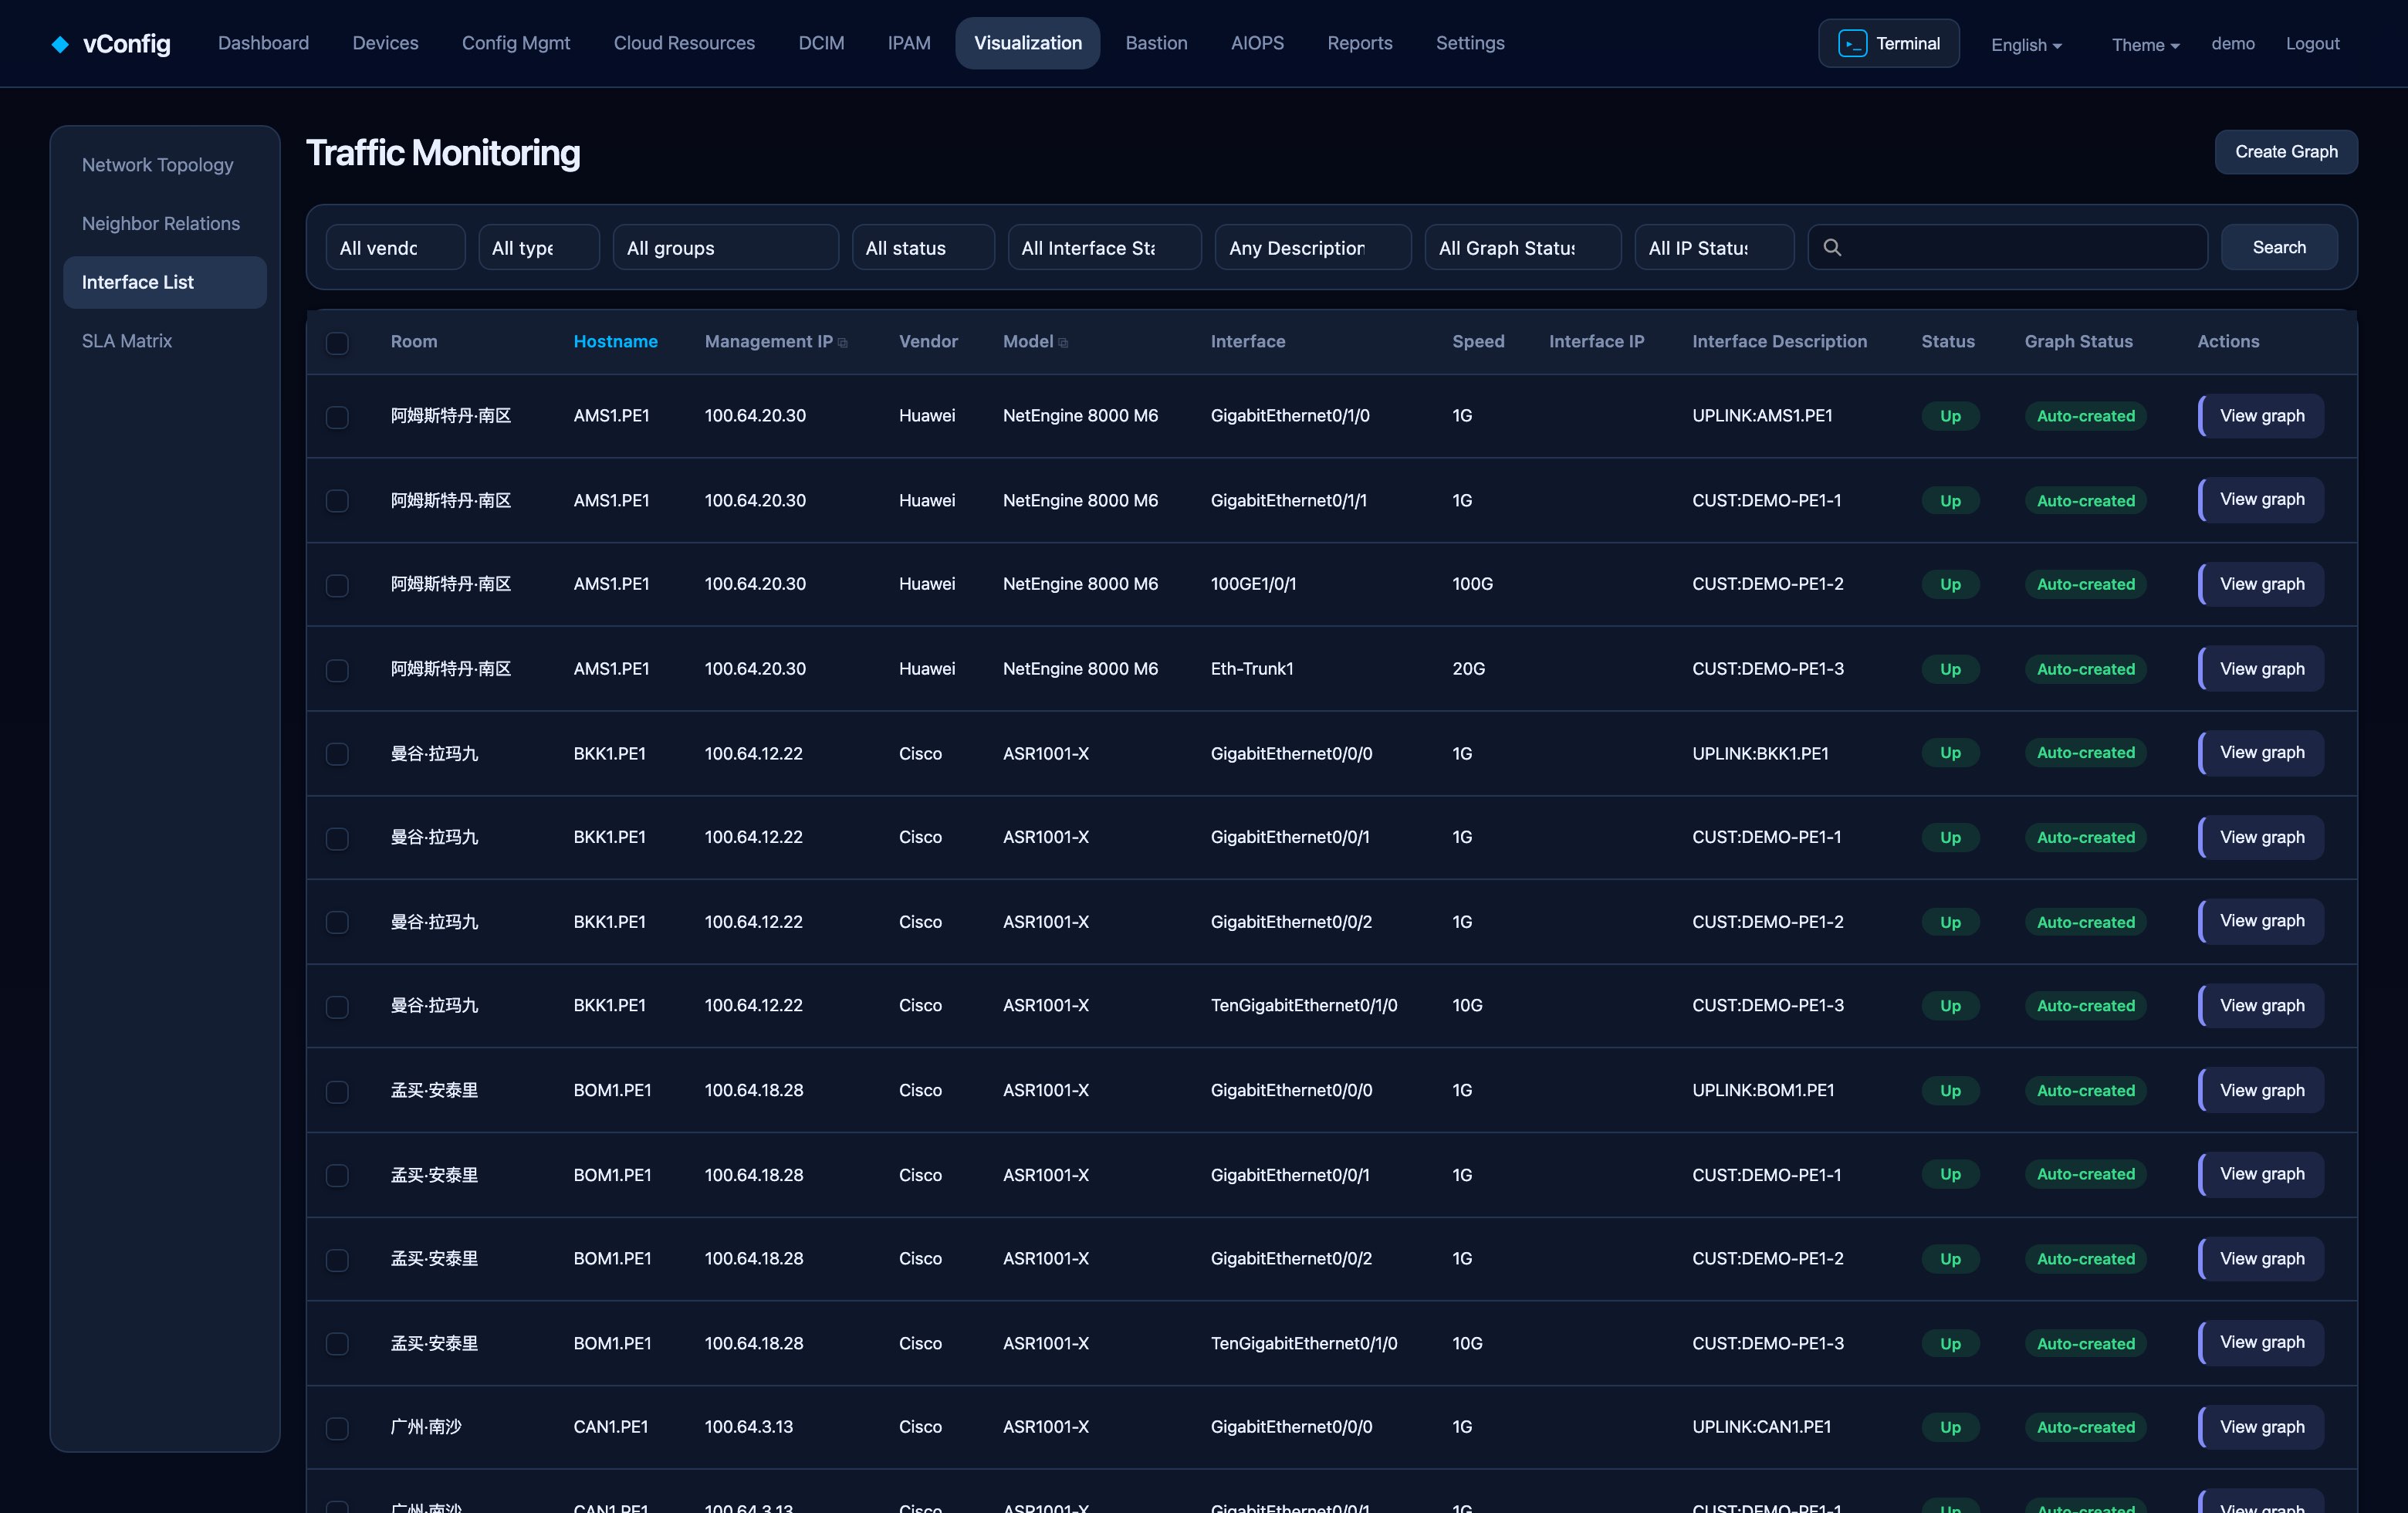
Interface list
Visualization → Interface list shows every known interface: data center, device name, management IP, vendor, model, interface, speed, interface IP, description, status and graph status.
Graph status tells you whether history is being recorded for that interface. Select interfaces and click Create graphs to start recording.
Why not graph everything
A large fleet has tens of thousands of interfaces, and most are irrelevant — unused access ports, loopbacks, sub-interfaces of sub-interfaces. Recording all of them costs disk and makes the list useless.
Settings → Monitoring settings → Interface graph filter rules lets you decide what qualifies automatically, typically by description pattern or speed, so new uplinks start recording on their own and access ports never do.
Clean invalid interface graph data removes history for interfaces that no longer exist.
Reading a graph
Open a graph and pick a window: live, 1 hour, 1 day, 7 days, 1 month, 1 year, or the calendar shortcuts last week and last month. Drag horizontally on the chart to zoom into a range; double-click resets.
Each graph shows bits received and bits sent, with latest / min / avg / max / 95th percentile printed underneath, plus in/out errors and discards on a second axis. The 95th percentile line is the number most transit contracts are billed on, which is why it is called out rather than buried.
Where else traffic shows up
- Topology links are coloured by live utilization and can be bound to these graphs — see Topology.
- Device performance graphs on the same page cover CPU, memory and other SNMP counters.
- Traffic surge alerts are raised from this data — see Monitoring & Alerting.