Monitoring & Alerting
The alert center is the single entry point for everything the platform can complain about — devices, circuits, performance, jobs and vConfig's own health.
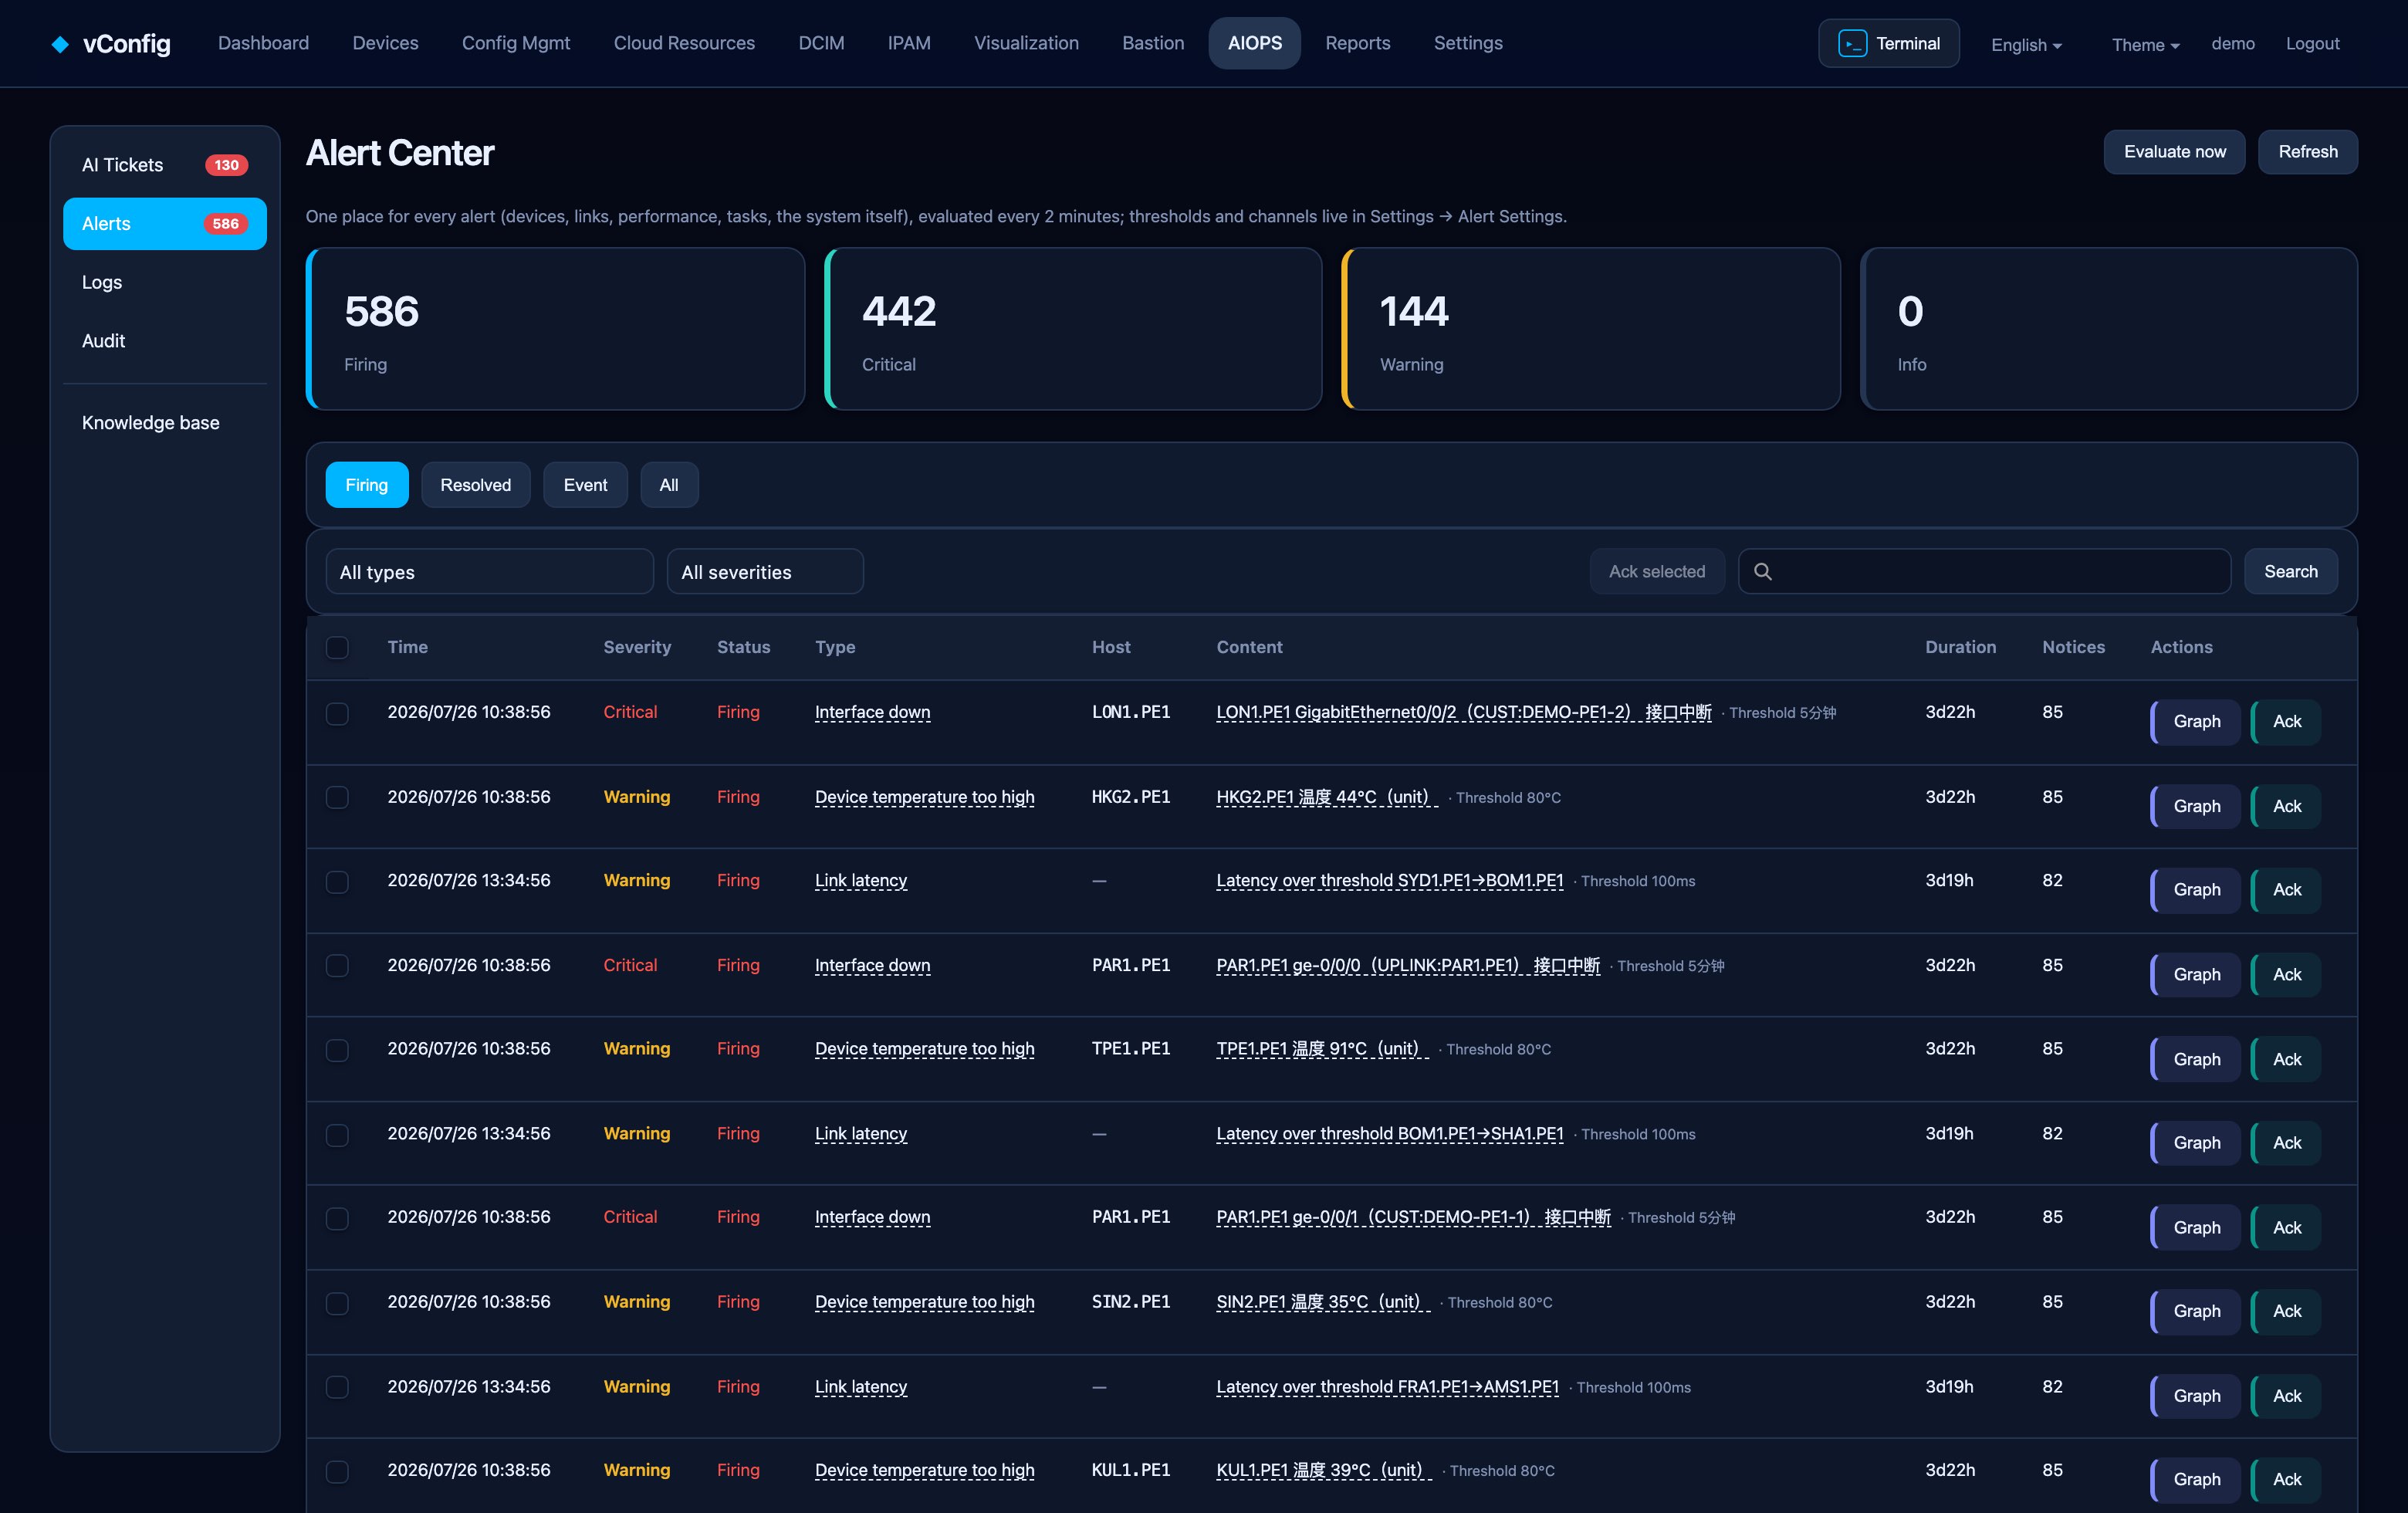
The alert center
Alerts lists trigger time, severity, state, type, hostname, message, duration, notification count and actions. Filter by Firing, Recovered, Events, or All, and search across the lot.
Evaluate now runs the rules immediately instead of waiting for the cycle. Alerts are evaluated automatically every 2 minutes.
Select rows for bulk acknowledge. Related alerts are grouped into events, which is what AIOps analyses — twelve alerts from one failure are one event, not twelve investigations.
What raises an alert
- Device reachability from the status probe.
- Link degradation — latency, jitter and loss from neighbor monitoring and the SLA matrix.
- BGP flapping.
- Traffic surges from interface graphs.
- Backup failures and configuration drift — see Configuration Backup.
- vConfig's own health — the platform reports on itself.
Thresholds live in Settings → Alert settings → Alert rules.
Notification channels
Settings → Alert settings configures delivery:
| Channel | Notes |
|---|---|
| SMTP server, credentials, recipients | |
| Webhook | Slack, Microsoft Teams, WeCom, DingTalk, Feishu |
| SMS | Any generic HTTP SMS gateway |
Every channel has a Test button. Use it — a notification path that has never been tested is a notification path that does not work.
Notification policy decides who is told what: severity routing, quiet hours, and repeat intervals so a firing alert nags without flooding.
Server health
Settings → System status shows the vConfig host itself: CPU, memory, disk utilization, disk IOPS, live NIC bandwidth and the state of each system service, refreshed every few seconds. Restart all components and per-service restarts live here too.